Earlier, I got a comment that my trading method using the 21EMA structure was difficult to follow, so I'd been thinking about whether I could offer a simpler, more straightforward approach. So I'm going to share my method using the LL-HL structure.
First, I've published an indicator on TV that automatically draws this structure.
https://t.co/CCYbrjGFiA
https://t.co/aZDcm7Uz1t
This time I've released an improved version on the site below, so I'll explain using that indicator. For details, check the posts below.
https://t.co/Lqa3nqVuNt
https://t.co/gwOzsyHw9r
Let's start with the prerequisites🙌
First is RS. I've published the RS indicator below.
https://t.co/lLdJNHTysT
https://t.co/uW2sorplLH
I like stocks with RS21 above 70 and RS63 above 80.
Next, a market cap above 1B and a 50-day average volume above 1M. For volume, it's preferable to have a day within the last 10 sessions that posted the highest volume in 10 days along with a green candle. I call this a PP.
Finally, stocks with ATR% from 50SMA below 5, ideally below 4. Occasionally there are stocks that keep climbing even above 7, but most of them tend to go through a pullback at some point.
https://t.co/twPoMeQbiu
That covers the prerequisites. From here I'll share how to use the indicator. And everything from this point on is determined by the closing price.
First, once the LL-HL structure completes, it's drawn on the chart, and I take a half position at the 1st Pivot. The stop here is the 21EMA Low. Next, the price needs to reach the 2nd Pivot within 5 sessions at the latest, ideally within 3. This is a characteristic of strong stocks. For example, even if the price is still above the 21EMA Low after 10 sessions, if it hasn't reached the 2nd Pivot, I close the position.
Next, after reaching the 2nd Pivot, I add to the position. At that point, the indicator moves the Stop to the 1st Pivot. The 2nd Pivot is an important price line and can act as resistance, so this is to minimize losses in case it drops afterward. It's also most preferable to have a PP occur on the day it reaches the 2nd Pivot.
And once the LL-HL structure is complete, the target points are already drawn automatically as well. These target points tend to act as resistance, so I take partial profits gradually in two stages as the price rises. However, depending on the chart structure, there may not be much room for profit, so my selling method is as follows.
I prioritize taking profit when the gain reaches 25% or more. Otherwise, I place my risk at the 21EMA Low at entry, and when the risk-reward hits 3 or the ATR% from 50SMA reaches 7 or above, I take partial profit on 33% of the position. For the remaining position, I do a final exit when it closes below the 21EMA Low.
One more important point: I prefer clean charts that are properly finding support at the moving averages, like the 10SMA, 20SMA, or 21EMA.
I share the stocks that meet these criteria every day as the Today's Watchlist, where I post stocks that reached the 1st Pivot or 2nd Pivot the previous day, as well as stocks where a PP occurred. I'd be happy if you find it useful.
And if you have any questions, feel free to comment😉
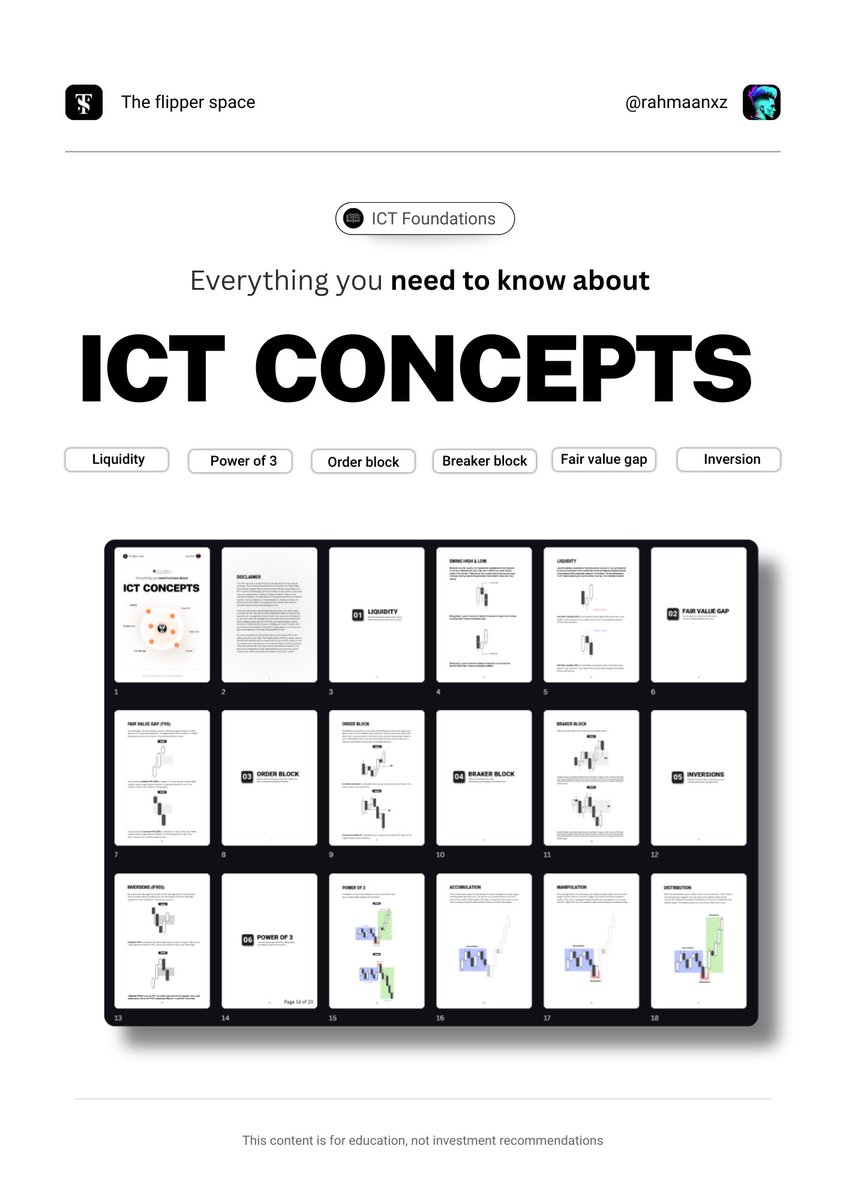
If you’re looking to learn ICT in 2026
Start here:
• Liquidity
• Order Blocks
• Fair Value Gaps
• Breaker Blocks
• Power of 3
• Inversions
If you want the full eBook,
Repost the post and comment “ICT” below.
Got some invites for giveaway 🔥 COMET invite
Follow these steps to get access:
✅ Like this post
🔁 Repost it
💬 Comment "Comet"
🚨 Follow me so I can DM you the invite





![jiunian_xx's tweet photo. 我把 X 书签接进 Obsidian 知识库了,全程不用 API Key,没有第三方插件,每天自动跑。
分三个阶段,思路是这样的:
阶段一
---------------------
手机 / 电脑收藏推文(跨设备同步)
↓
每早十点自动触发脚本(cc定时任务)
↓
用Cookie 调 X书签,增量拉取,拿回书签的 JSON 数据
↓
提取新书签 URL,写入 00_收件箱/Twitter-URLs.md
↓
更新 processed_ids.json,记录已处理 ID
↓
触发自建skill
阶段二
---------------------
自建skill触发
↓
对每条 URL 走三级降级:① fetch_tweet.py --url:结构化 JSON,拿原文 + Quote Tweet + Thread | ② https://t.co/6p3dM4h87K]:自动转 Markdown |
③ WebFetch:最后兜底→全败 → 标 UDF,等手动处理
↓
cc 按���板生成文件前缀+笔记+正反向链接
↓
清空Twitter-URLs.md
↓
确认继续操作
阶段三
---------------------
确认继续操作
↓
读文件前缀,分流到对应��录
↓
更新各目录的检索
↓
结束
至此,一个总结分类推文的自动化工作流程就结束了。
其实这三个阶段的流程,是可以缩减为两个阶段,甚至合并为一个阶段的,还是得看具体的需求去调整。
思路已经提供在这里了,具体的细节我还需要再调试。如果之后能够把它封装成一个 Skill,我会分享出来。](https://pbs.twimg.com/media/HD-joSGaIAA6yyq.jpg)