Return is only half the story. This test showed a 7.80 Sharpe ratio, 5.72% max drawdown, 20.24% volatility—and a 0.00 win rate. That combination makes me want to verify the metric definitions before trusting the result.
Not financial advice. #RiskManagement#Backtesting#AInvest
I was browsing AInvest’s themed screeners and the contrast stood out: S&P 500 Leaders showed a +22.87% 3-month return, while Shareholder Yield Value Stocks showed +52.04%. A useful starting point—not a conclusion.
Not financial advice. #Stocks#Screener#AInvest
This AInvest backtest showed the S&P 500 Leaders strategy returning 25.78% versus 9.72% for $SPY over Apr 11–Jul 10, 2026. The 157.96% CAGR is annualized from a short window, so I wouldn’t read it as a long-term expectation.
Not financial advice. #Backtesting#SPY#AInvest
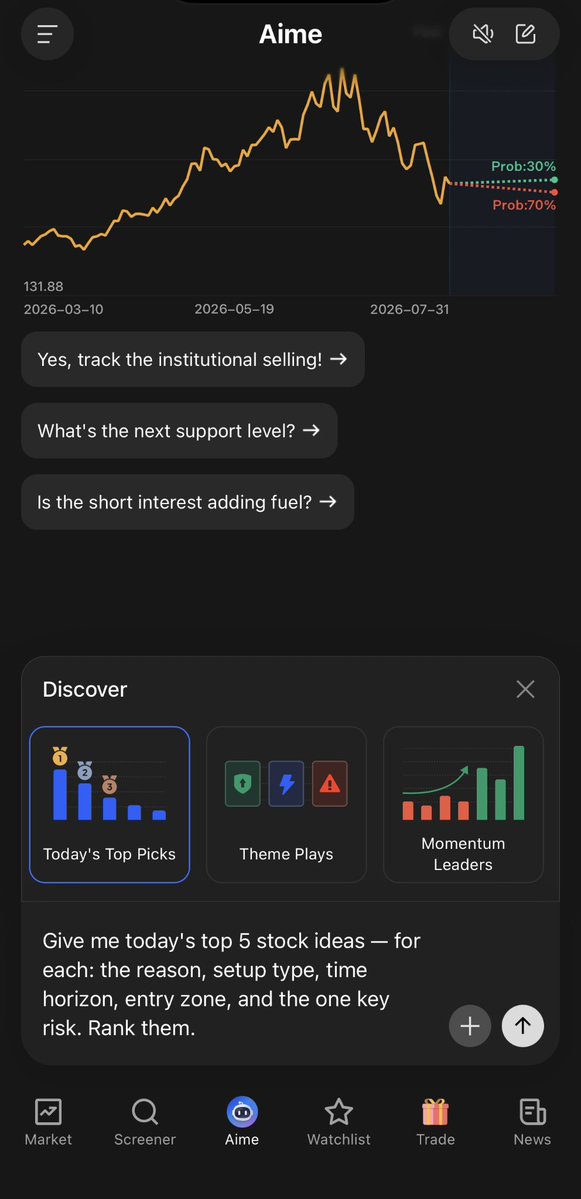
$PTCT was clearly labeled higher risk, which I appreciated. Oversold bounce setups can look tempting, but insider selling during a selloff changes the risk profile. Not Financial Advice. #PTCT#TradingRisk
I asked Aime for today's top 5 stock ideas with reasons, entry zones, and risks. That prompt is the real hack: force the watchlist to explain itself first. Not financial advice. #Aime#Stock
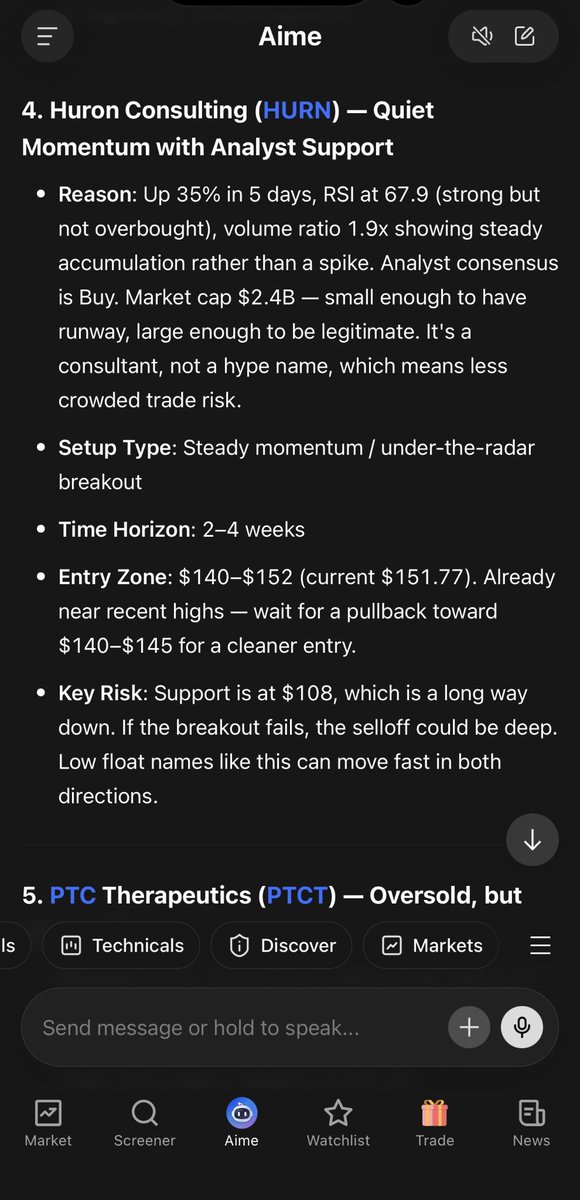
$HURN was the quietest idea on the list: up 35% in 5 days, analyst consensus Buy, and less crowded than hype names. Quiet momentum still needs an exit plan. Not Financial Advice. #HURN#StockResearch
Behind $AAPD’s 7.44% surge: $60.05M inflow vs. $56.51M outflow, a net +$3.54M. Medium orders drove the positive gap, while small orders were slightly net negative. Price shows what happened; order flow hints at who was pressing. #AAPD#AAPL#OrderFlow#Trading
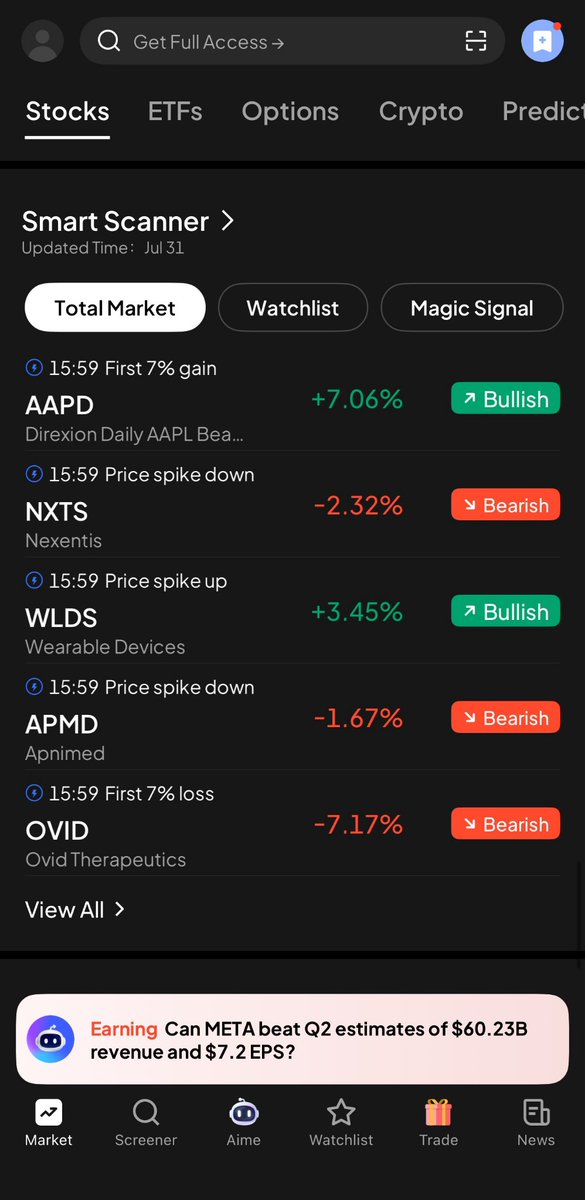
Late-session moves can change the whole setup. AInvest’s Smart Scanner flagged $AAPD’s first 7% gain alongside sharp moves in $WLDS, $NXTS, $APMD and $OVID at 15:59 ET. One screen, bullish and bearish signals before the close. #StockScanner#AAPL#Trading#AInvest
$AAPD isn’t a traditional long-term ETF: the screen shows $32.64M AUM, a 0.96% expense ratio and a one-day inverse target tied to $AAPL. Even with $26.38M in 1-year flows, compounding and path dependency matter. Know the structure. #AAPD#InverseETF#RiskManagement
The market is nearly one-sided: $NVDA 88.8%, $AAPL 10.8%, and every other contender near 0.1%. With $3.2M in Nvidia prediction volume vs. $1.5M for Apple, traders see AI leadership winning July. But probability isn’t certainty. #NVDA#AAPL#MarketCap#TechStocks
Markets don’t just track prices—they price expectations. AInvest shows $NVDA at 84% to end July as the world’s largest company, while another market puts a U.S. invasion of Iran before 2027 at 25%. Signal or noise? #PredictionMarkets#NVDA#Geopolitics
Prediction markets had a wild July. $NVDA’s odds of ending the month as the world’s largest company fell below 10% before rebounding to 88.8%, while $AAPL dropped back to 10.8%. One chart, a month of changing conviction. Not financial advice. #NVDA#AAPL#PredictionMarkets
At 14.09x P/E, the model still calls $IT fairly valued—not euphoric. Gartner sees IT spending hitting $6.37T, driven by AI infrastructure. Great story, but Aug. 4 earnings must confirm it. I’m watching, not chasing. Not financial advice. #AI#Earnings#TechStocks
The market was bleeding, but my bullish scanner lit up. $IT jumped 6.29%, $ADP gained 3.48%—and Gartner immediately stole the screen. When strength shows up on a red day, I pay attention. The real question: breakout or pre-earnings FOMO? #StockMarket#StocksToWatch
Now the uncomfortable part: $IT trades above the app’s $154.25 average target, while 61% of analysts still rate it Hold. Price is yelling “breakout,” Wall Street is whispering “too far, too fast.” Momentum or trap—which signal wins? #WallStreet#StockMarket