Put together matchup cards for some of the games today. Nothing on these cards is a lock, and the listed price targets matter. Verify the current lines, check official lineup status and batting order, and pass on anything that has moved beyond the playable range unless you want to take the juice.
Use the analysis to narrow the board down, then only take the angles you personally agree with. There is no reason to force every game, every prop, or multiple correlated versions of the same matchup.
The goal is to find the spots where the model, matchup data, role, lineup position, and available price all make sense together.
Today’s MLB projections are up.
The cards cover the full game board, top batter and pitcher signals, and the model’s strongest overall angles for the slate. As always, these are pregame projections based on the information available when the model ran, so lineups and late changes can still move things around.
Yesterday’s results are in. The calibrated moneyline finished 11-4, totals went 10-5, the pitcher signals hit 16 of 20, and the Top 9 finished 6-3.
The batter card was the worst part of the day, but the pitching side was very strong across strikeouts, hits allowed, and earned-run projections. Full results are on the cards and at https://t.co/JoALRe1IdK
I’ve been working on a major upgrade to the MLB analysis side of the site.
Instead of treating every model edge like it belongs in the same list, the new system separates the slate into eight stricter homepage picks, deeper strategy options, and research-only candidates. Each matchup is also ranked and labeled based on whether it has a supported game angle, is better approached through props only, or does not have enough to force a play.
The review page brings the projected score, first-five outlook, batter projections, recent offense, weather, reliability, supporting evidence, and biggest risks into one place. It also shows why a pick qualified, why another one was downgraded, and when the model does not have enough agreement to recommend a game line.
This is still being tested before anything is added to the public site. The goal is already taking shape by adding clearer reasoning and a much better way to separate the strongest plays from everything else.
Today’s layer analysis is ranked from the games with the cleanest agreement across the score, pitching, batter, first-five and calibrated layers down to the matchups with more conflict or missing information.
These are not automatic picks. The cards show where the model’s strongest signals are coming from, where the safer route may be different from the projected winner, and which games need more confirmation before trusting them. All lineups are still projected, so verify lineups as they become available.
Today’s projections are up.
Milwaukee is the strongest game lean with the Miz on the mound, while Paul Skenes and Nick Martinez lead the pitcher signals for Ks and hits allowed. Otto Lopez stands out across both hits and HRR, with Ketel Marte leading the total-base board.
It looks like Baltimore and STL could face weather if the games get played today. There are several close games and a few calibrated ML flips, so the safer spread options may be more useful than forcing moneylines.
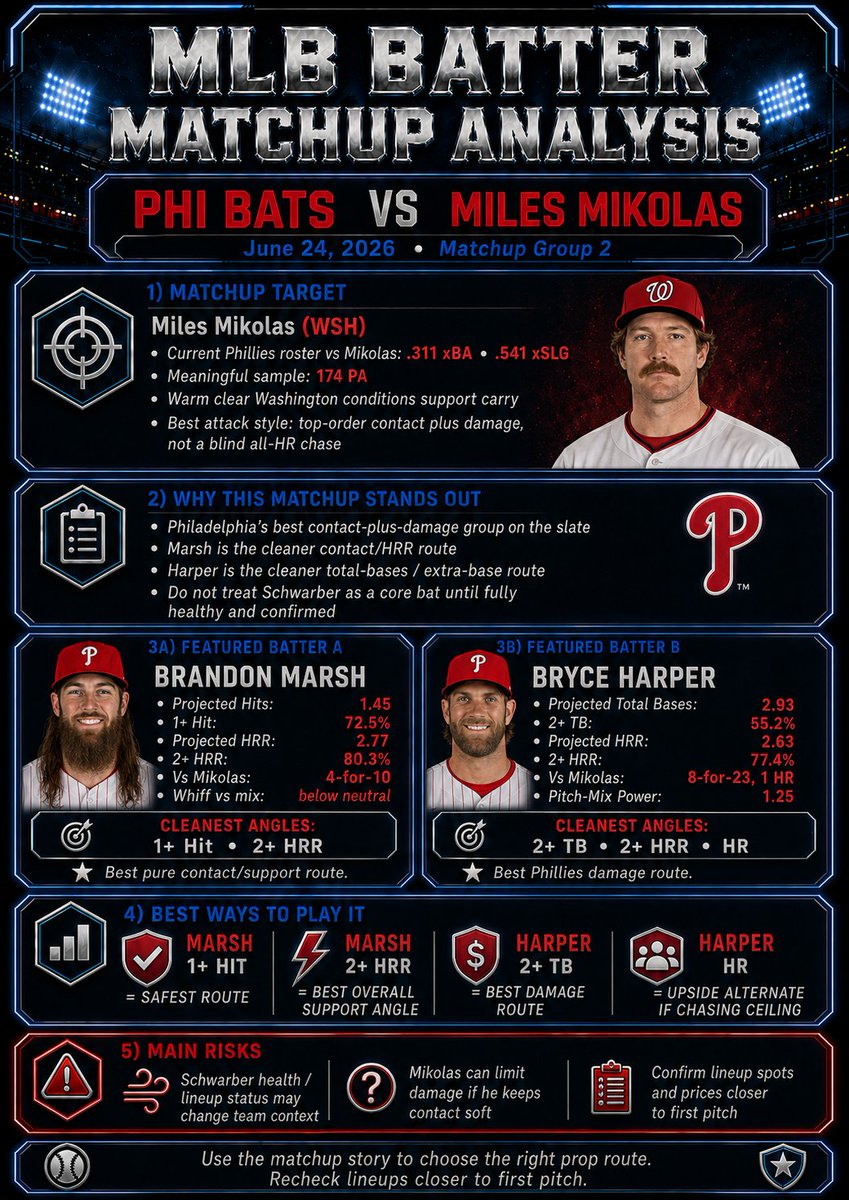
Yesterday was a little uneven overall, but there were still some really strong spots. The spreads and totals carried the game card, while Brandon Marsh, Pete Crow-Armstrong and several of the pitcher signals came through.
ARI–STL was postponed and Arraez out left a lot of voided options throughout. MLs and pitcher props were the biggest misses on the day.
Here are today’s layer analysis rankings and where the different layers within the model agree/disagree.
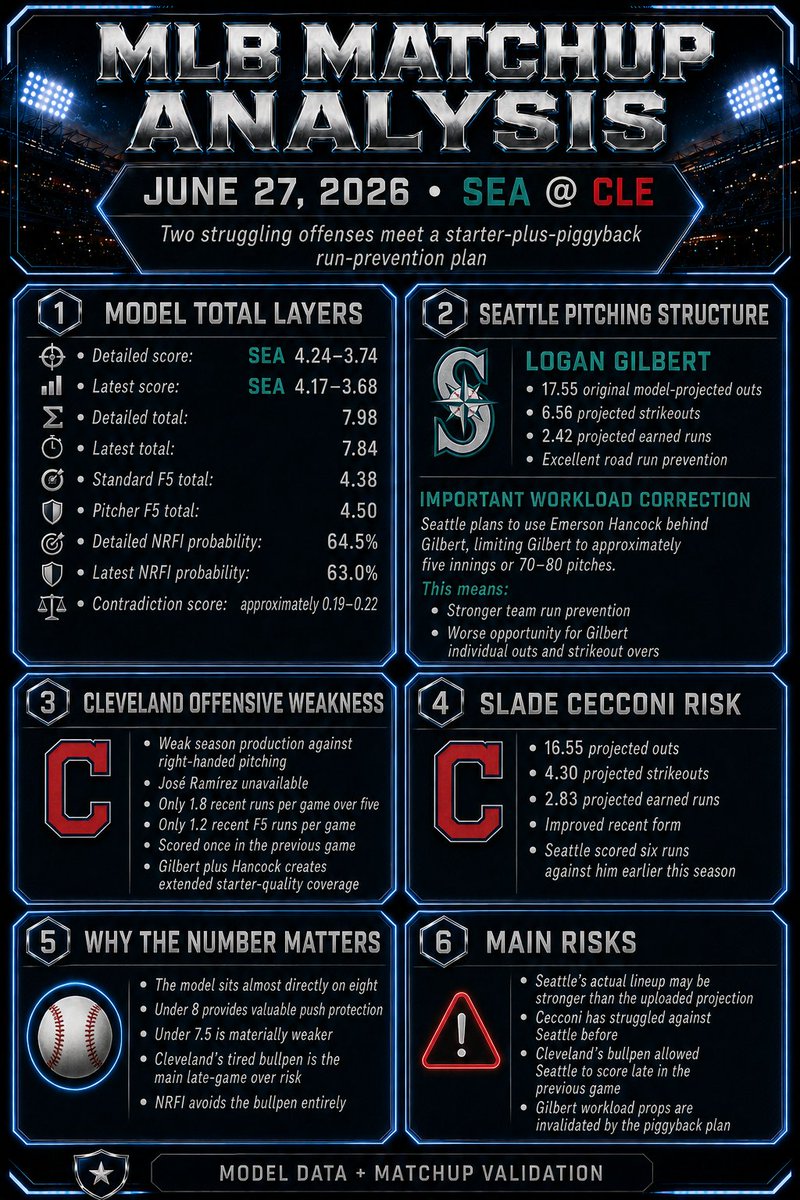
Philadelphia stands out with the strongest full-game support across the board, although they have had late game comebacks in both previous games. Seattle and Detroit also carry clean directional agreement. Detroit’s calibration drop keeps it from being treated like an equally strong play.
The middle of the slate has usable angles, but each comes with a real caveat. The Yankees are strongest early, the Giants’ run environment looks better than simply backing the side, and Toronto–Texas is close enough that calibration completely changes the direction.
The bottom three are where the contradictions take over. Tampa Bay–Kansas City is nearly a toss-up, Arizona–St. Louis has a sharp full-game versus early-layer split, and Cubs–Mets carries the highest contradiction score on the slate.
These rankings are not just the projected winners—they show where the model layers actually agree, where they split, and which matchups deserve more caution.
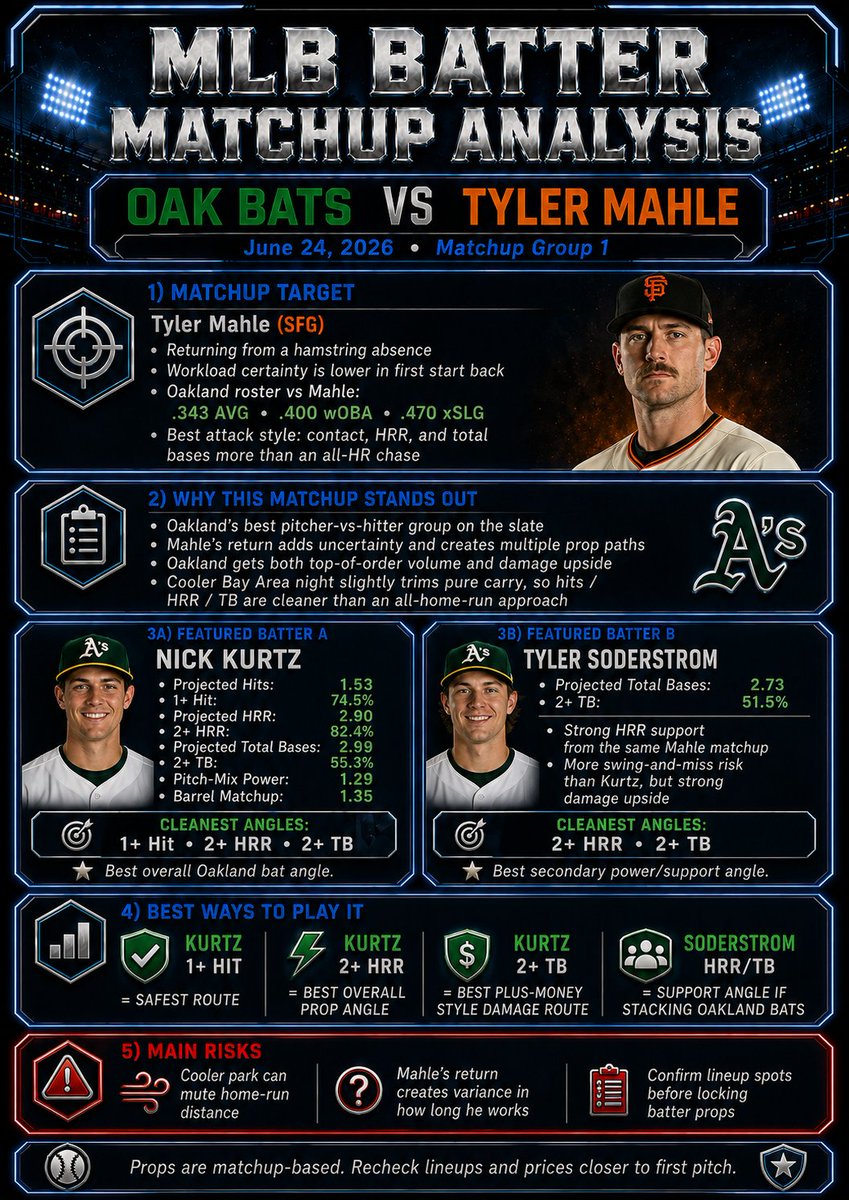
Today’s slate is smaller with only nine games, but there are still a few strong spots across the board. The model’s best game lean is Philadelphia, while the clearest prop signals are Zac Gallen’s hits allowed and Connelly Early’s strikeouts. OAK–SF also stands out as the top YRFI matchup.
There are several close projected scores and a few calibrated flips, so I would be more selective with moneylines today. The spread board looks stronger overall, especially Detroit +1.5, the Mets +1.5 and Kansas City +1.5.
Another mixed day. Spreads and MLs did well and totals still struggled. The batter model was high on Durbin and he left injured early in the game. Hopefully with the series switch the props will get back on track.
I went back through the slate and narrowed this down to the five pitcher-versus-hitter matchups I found most interesting.
These cards are not just a list of the highest model projections. I compared recent form, handedness splits, pitch mix, barrel and whiff profiles, lineup position, previous history where the sample was useful, and the different ways each batter can get there.
Some matchups are better for a simple hit or HRR. Others have enough damage support to consider total bases or a home run. I tried to show the safer route, the higher-upside route, and the main reason each matchup could still fail instead of treating every good projection the same.
Lineups and prices still matter, so these are the matchups I want to revisit once everything is confirmed.
Today’s deeper matchup analysis focuses on five games where the model offered enough agreement, market depth and supporting data to build a full two-card set.
HOU–TOR and PHI–WSN look strongest through team scoring rather than forcing a side. KCR–TBR and BAL–LAA are more props-driven, with the best value coming from pitcher workload or strikeout markets and selective batter production. OAK–SFG carries the clearest total-and-bats setup, although Mahle’s return adds uncertainty.
These are not meant to be five separate same-game parlays. The better approach is to choose one or two angles you trust most, or mix the strongest legs across games. Lineups are still projected, so batter picks and prices should be checked again before first pitch.