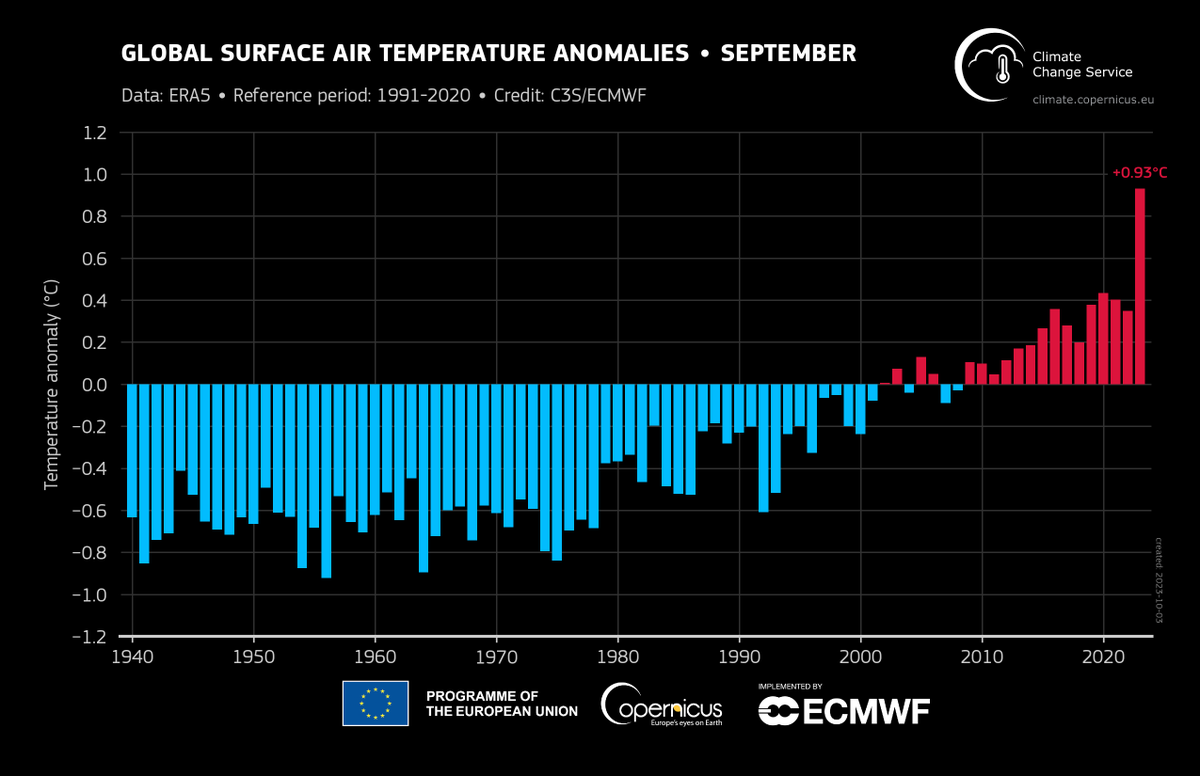
Jesus christ. I think I need to turn to alcohol or drugs or therapy or SOMETHING. I had seen the AMOC overturning warnings, but I had not seen this graph. I though somehow mostly the North Atlantic and Europe would be affected, but no, it's global boiling.
https://t.co/34oKU720IU
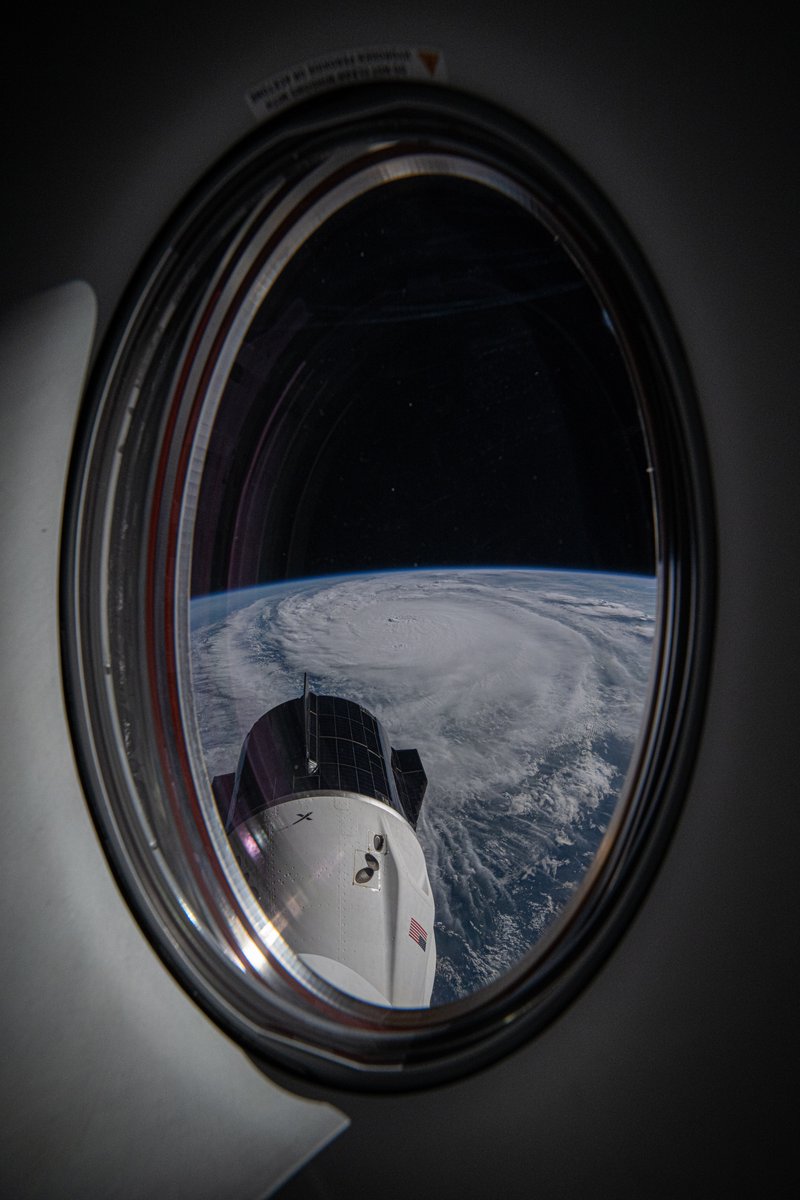
We flew over Hurricane Milton about 90 minutes ago. Here is the view out the Dragon Endeavour window. Expect lots of images from this window as this is where I’m sleeping while we wait to undock and return to Earth.
Timelapse coming in a separate post.
1/6400 sec, f8, ISO 500
Walking underneath a #glacier in a proglacial lake. Extraordinary experience today!
And hey, it's not a good sign: only in dying ice, such channels are accessible - and will soon be gone completely
Sure! The shortest version is: humans are endothermic, meaning we make our own body heat. We have to stay in a Goldilocks zone between too hot and too cold. If we're too hot, we sweat, our swear evaporates and it cools us off.
With me so far?
Are you a polar scientist? Do you identify as a woman? Have you conducted fieldwork in the Arctic, Antarctica and/or the Third Pole? Please help us to document and gather empirical evidence on polar fieldwork experiences of women-identifying researchers!
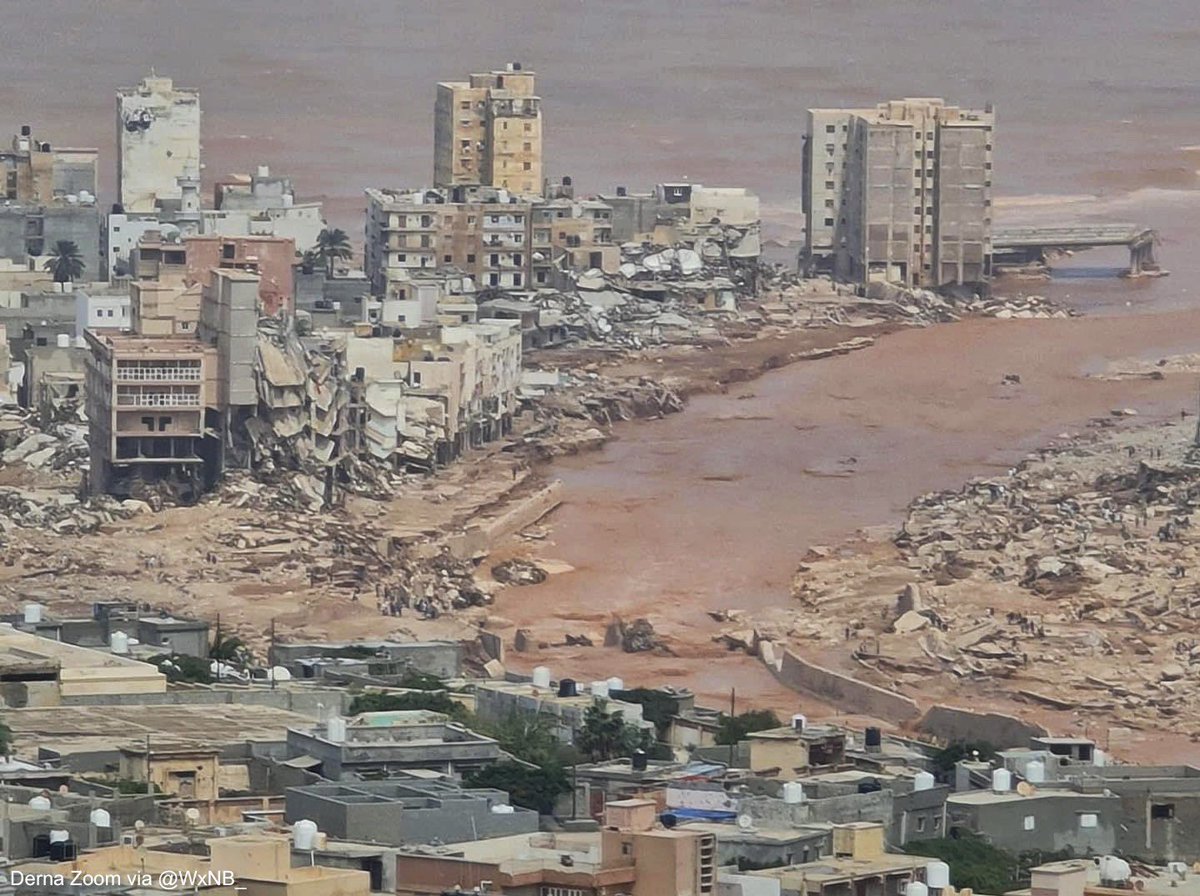
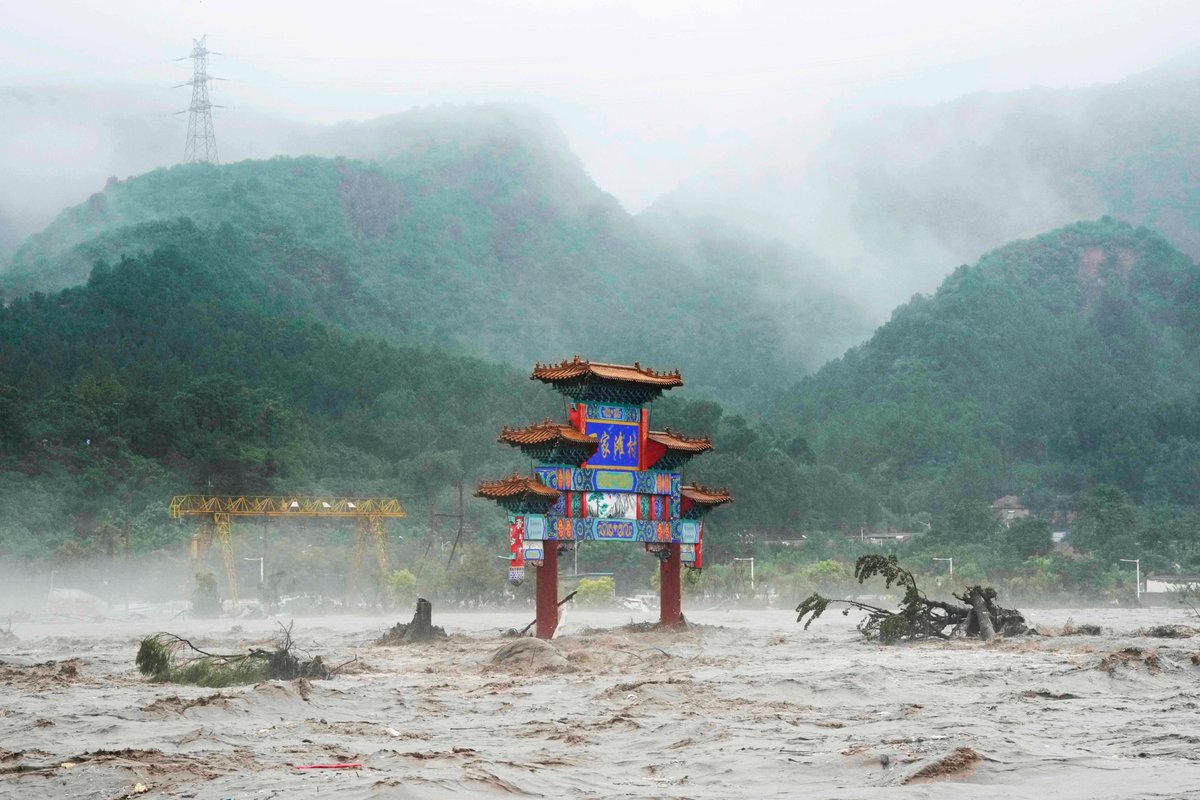
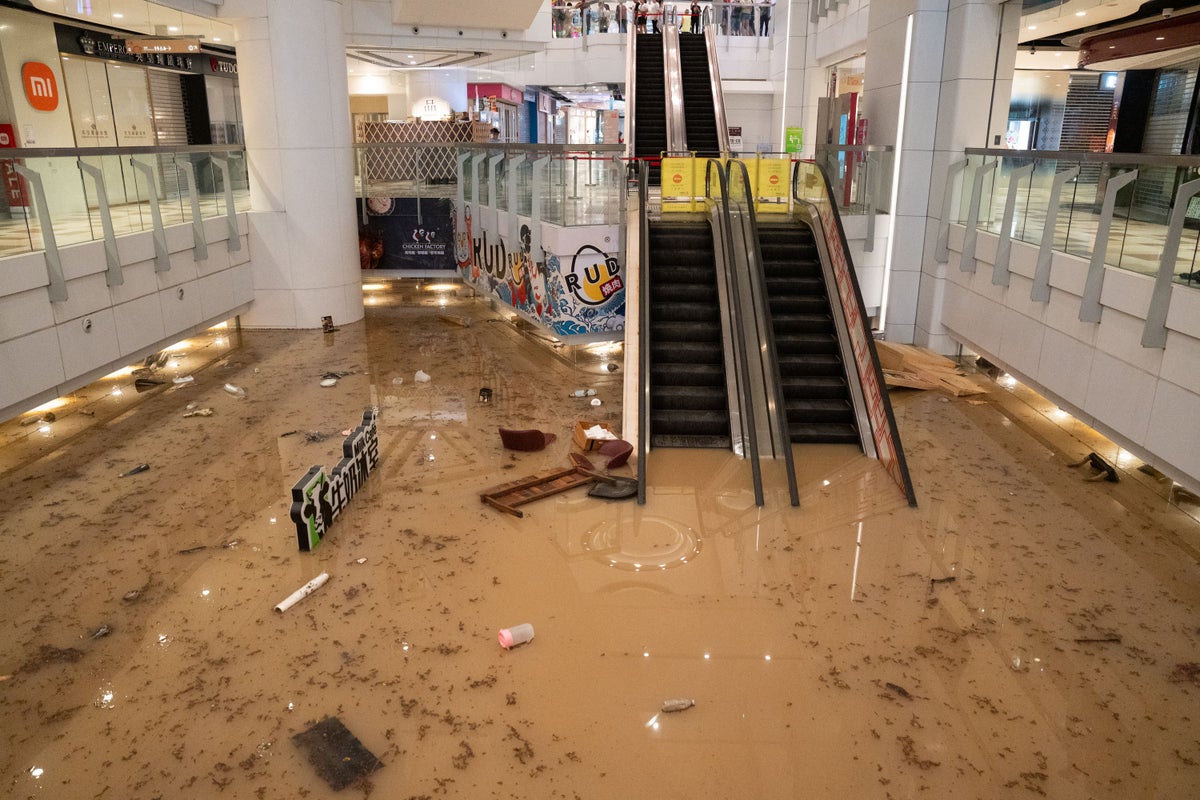
🧵Since it is becoming hard to keep track, here is a list of countries/municipalities that have seen catastrophic flooding in the first 11 days of September 2023:
- Greece
- Turkey
- Libya <--- *thousands feared dead*
- Brazil
- Hong Kong
- Shanghai
- Spain
- Las Vegas
There's a growing fear that some tipping point has been reached. Not only is the North Atlantic water temperature 4 standard deviations above the 1991-2020 mean, but the Antarctic sea ice coverage is 6.4 standard deviations below the 1991-2020 mean. A bona fide #ClimateEmergency.
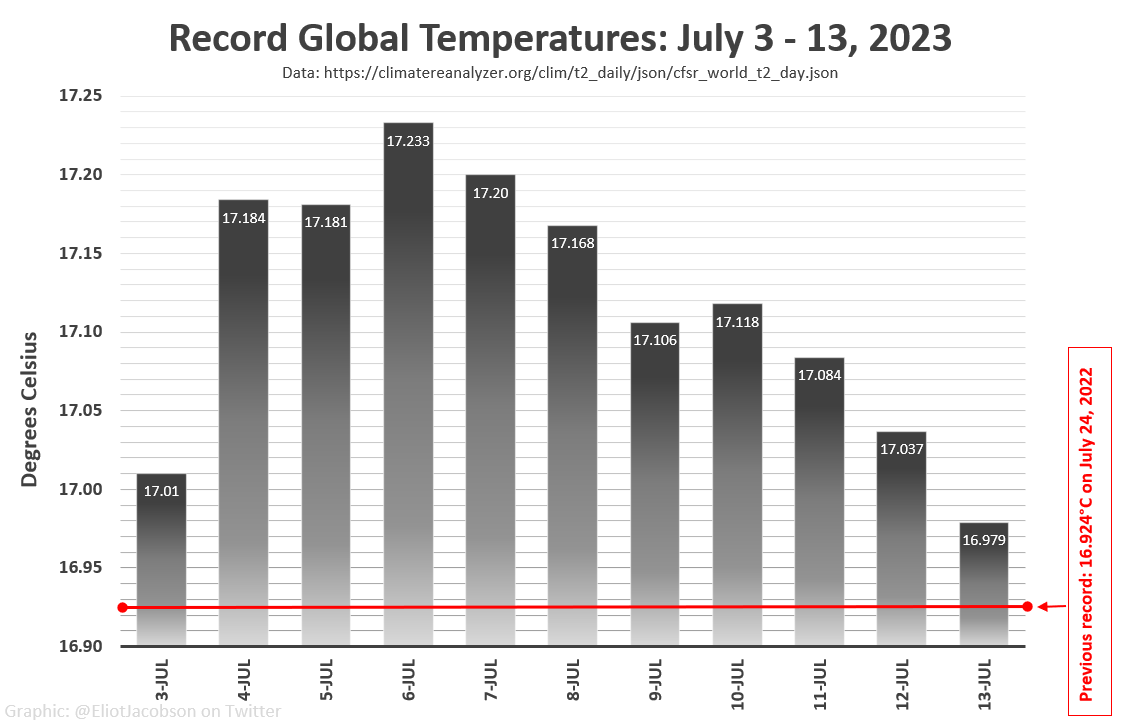
In case you were on a different planet and missed the big news, we have now had 11 days in a row setting new all-time modern global temperature records, peaking at 17.233°C on July 6, quite possibly the hottest 11 days globally in the last 100,000+ years.
https://t.co/SycQNYfGYD
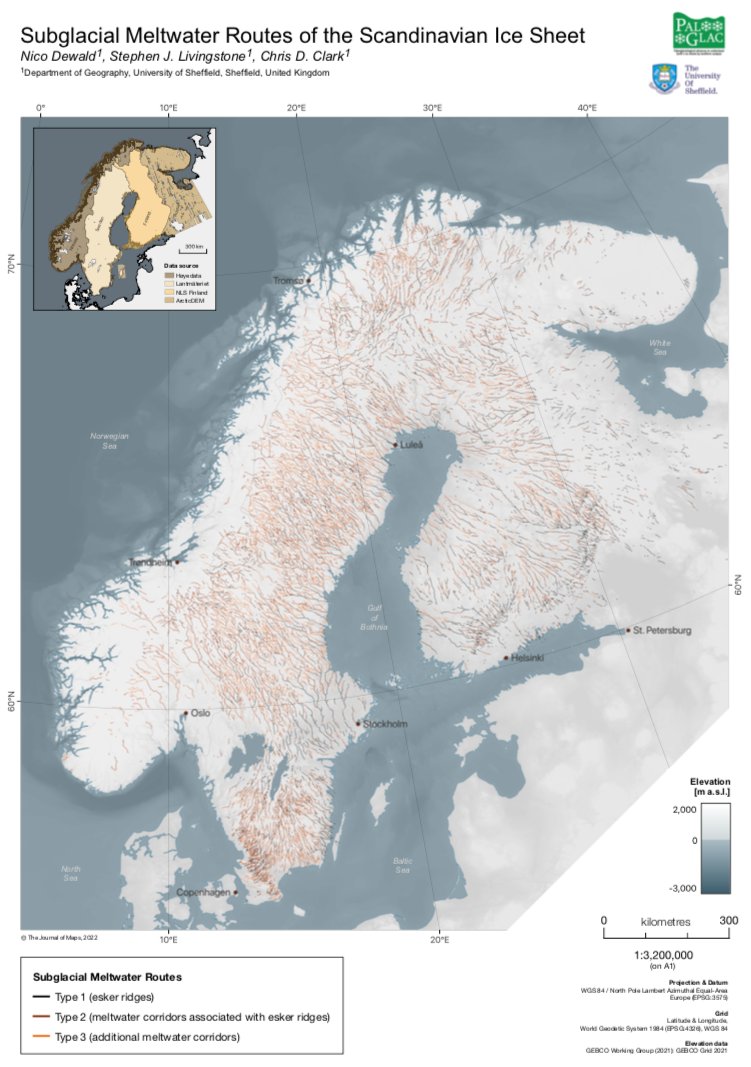
Our map showing subglacial meltwater routes of the Fennoscandian Ice Sheet has been published! A lot of podcasts went into this and I'm happy to see it's out in the wild now. Huge thanks to @living_stephen, @ChrisClarkofBC and team @PalGlac for their extraordinary support!
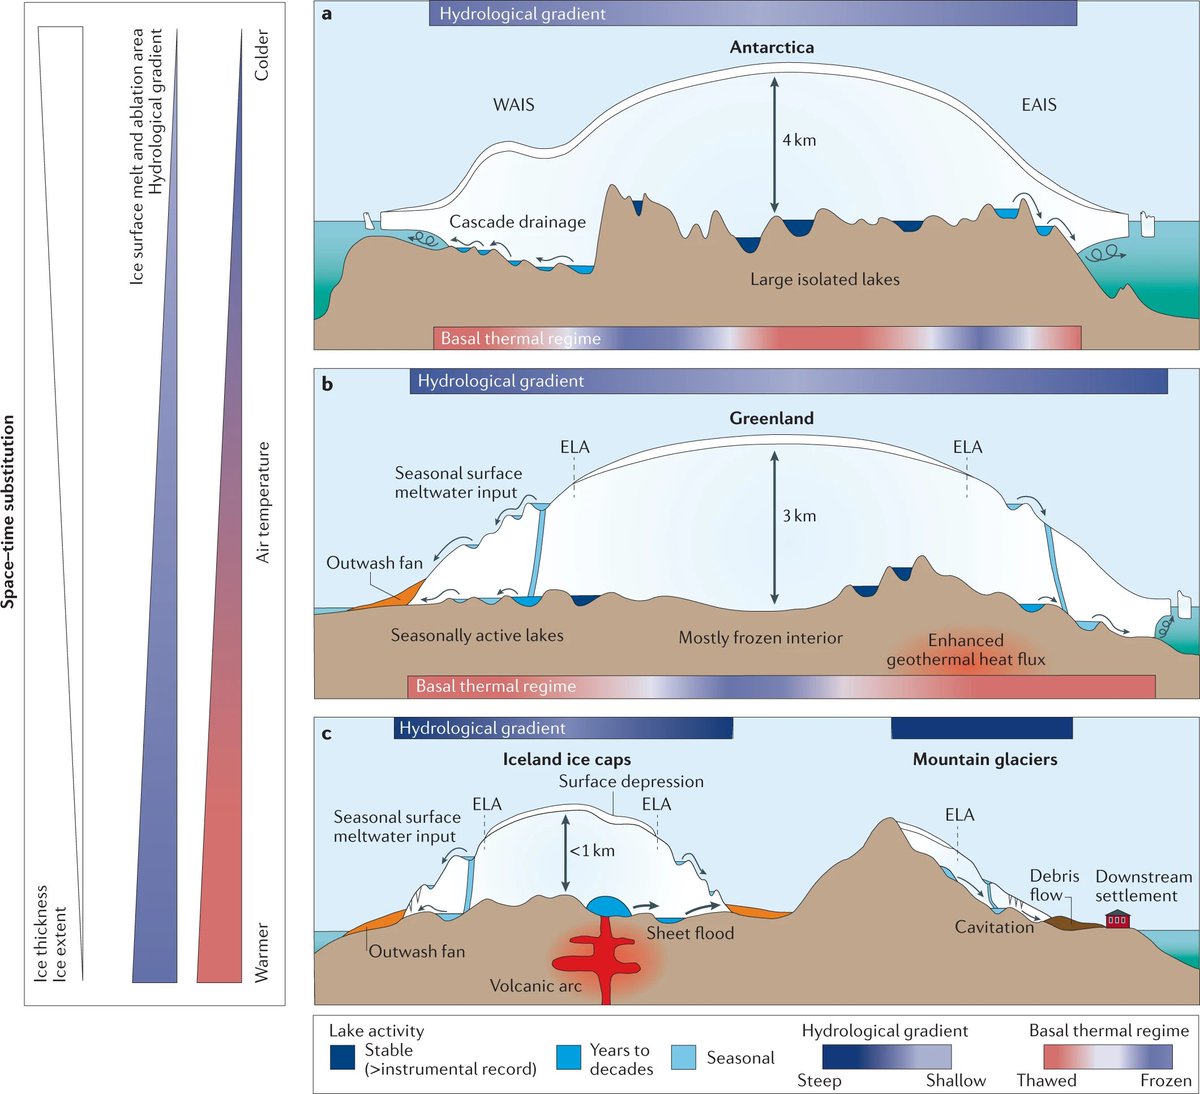
Over 700 lakes beneath #glaciers🧊impact hydrology and host ecosystems.
@living_stephen et al present a global🌎 inventory and discussion of subglacial lakes in this new review.
https://t.co/CpsQDyMhIQ (free to read https://t.co/uRes47aCrG)
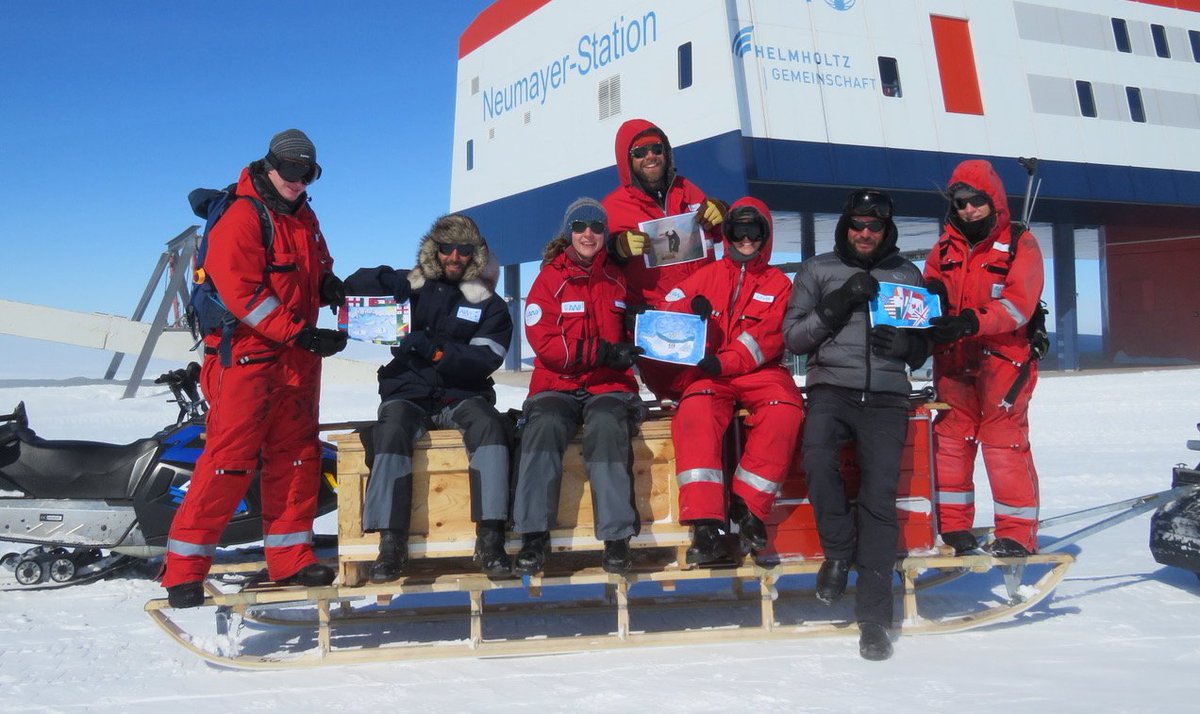
Happy #AntarcticaDay! On this day in 1959, the Antarctic Treaty was signed.
Some of the flags designed by schools in our @UKPolarNetwork#AntarcticFlags project have already made it down south, here with @AWI_Media! 🇦🇶
Congratulations @Nico_Dewald on his first PhD paper! 🥳🥳 We suggest esker enlargements were formed by subglacial conduit collapses. Worth reading for the figures alone (some beautiful examples of eskers and collapses on modern glaciers)!
Happy to share that our paper on esker enlargements has been published! Huge thanks to @LewingtonEm, @living_stephen, @ChrisClarkofBC and @rob_storrar for their invaluable support and being able to make sense of what I initially put down on paper.
https://t.co/MDpPVCUaBz
@PalGlac
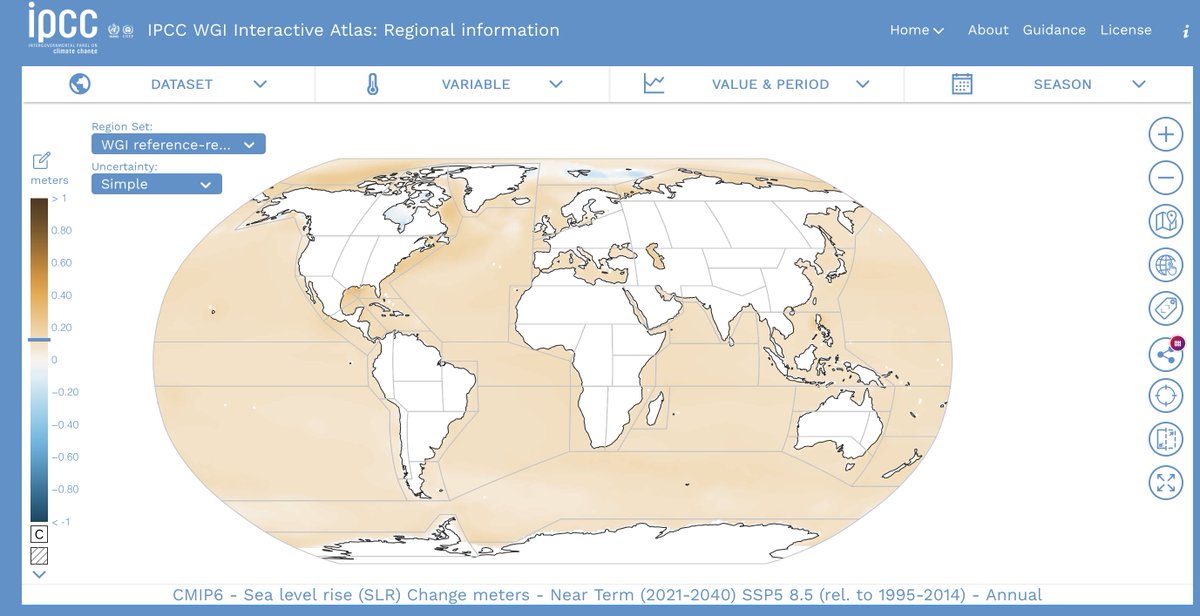
One of the coolest features of #IPCC 6th assessment report (#AR6 - WGI), released today, is undoubtedly its interactive atlas. Have a go and explore the data by yourself (you can even dowload them 🥳)
Welcome to the 21st century @IPCC_CH https://t.co/JApEdKC4RM
This isn't getting enough attention quite yet: For the first time, the @IPCC_CH has published an interactive climate atlas where you can explore your region's potential climate future. It's not comforting, but is impressive work. https://t.co/KgmwmXJV0c
Almost four years since I finished at @SheffieldPAC, my work on the formation of a Northern Irish esker system is finally published! Until June 8th it is available through this link https://t.co/gg15YpHKgn Key findings below: