1 trillion data points, in real time, in WPF, WinForms or UWP
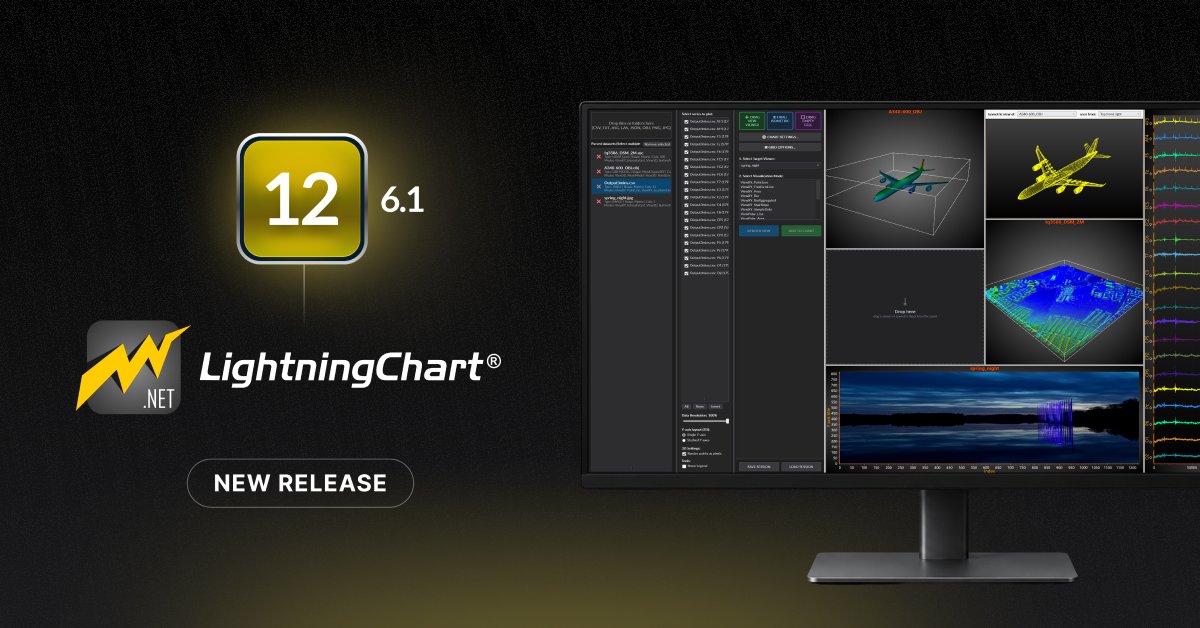
⚡LightningChart .NET: fully GPU-accelerated, 200+ charts, now on .NET 10 with v12.6.1.
Try it free for 30 days 👇
https://t.co/izwuX6LX9n
Still on an older LightningChart .NET? v12.6.1 brings:
⚡ Custom-colored lines up to 100x faster at 1M points
⚡ Universal Data Parser for WPF dashboards
⚡ .NET 10 support
⚡ 5 new Trader indicators
Try it free 👇
https://t.co/V4a0MG0Jad
Metrum moved its power quality software from desktop to web with Blazor WASM. When standard charts fell short, they added LightningChart JS: yearly data zoomable down to 1 minute, with API-aggregated data at every zoom level ⚡
Case study 👇
https://t.co/ZHxgMIm65J
Using Blazor? LightningChart JS runs inside it.
Demo project on GitHub, a MAUI Blazor Hybrid demo, and a license tip: Blazor blocks Developer license verification by default.
Docs 👇
https://t.co/v9toU0ywj3
https://t.co/7GV6bGhiqd
#Blazor#dotNET#DataViz
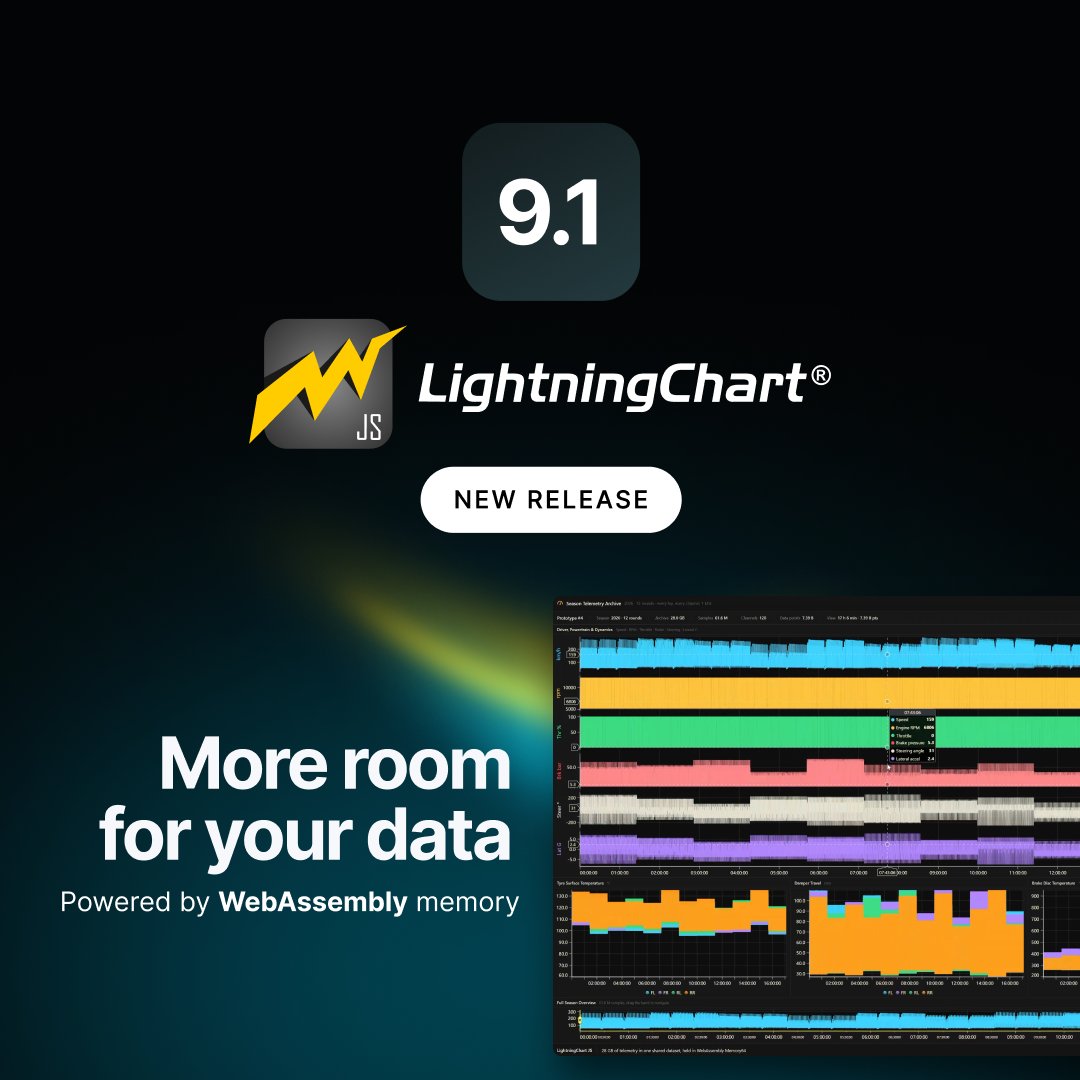
LightningChart JS v9.1.0 is out.
One flag enables http://WebAssembly.Memory, and your data ceiling becomes the machine’s RAM instead of the browser’s limit.
Our test: 29 billion data points in one multi-channel XY line chart, on 110 GB.
https://t.co/ftbrlCAnNl
Need your LightningChart® project built right, fast?
Development Work Kits: senior engineers from the team that built the library. PoCs, integrations, optimization. Fixed scope, IP is yours.
👉 https://t.co/hfGSmxjqdV
#LightningChart#DataVisualization#JavaScript#dotNET
Humans spot a colour change faster than a number.
LightningChart® JS DataGrid: live cell coloring, in-cell spark charts, drill-down events, unlimited rows. A real-time table that works like a heatmap.
👉 https://t.co/nlzbvFlqZ3
#LightningChart#JavaScript#DataGrid#RealTimeData
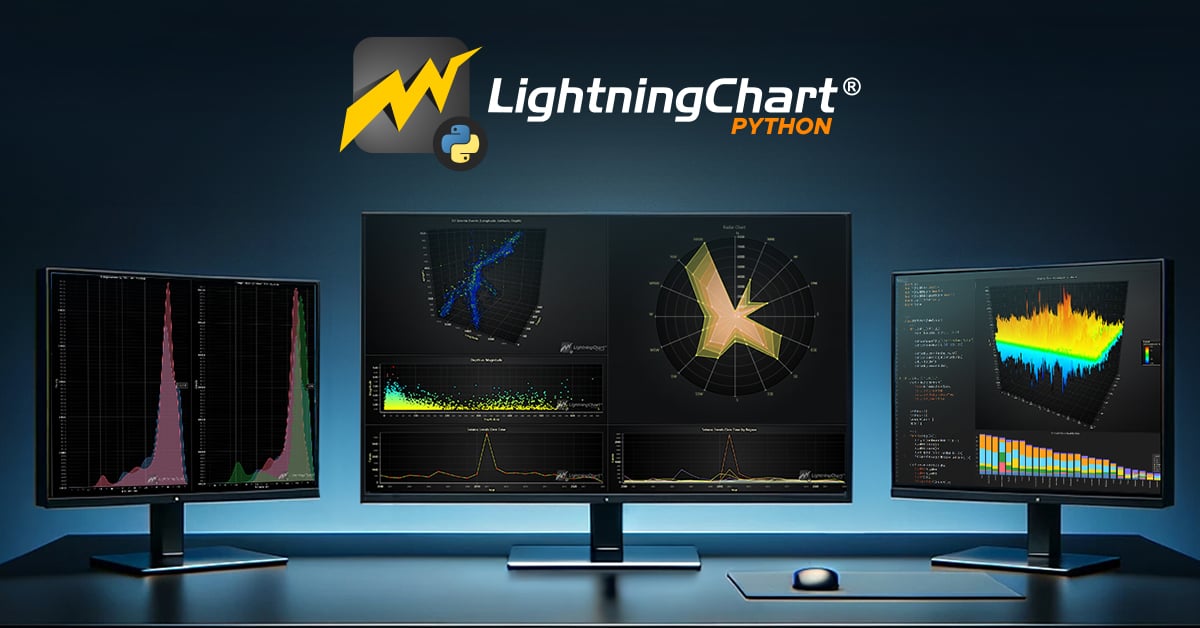
LightningChart® Python was born in a research project.
AIMODE: Metso, VTT, Aalto University and LightningChart using ML and digital twins to boost mineral recovery. Researchers needed fast Python charts. So we built them.
👉 https://t.co/ZB4HZ4DKuV
#Python#MachineLearning
69M seismic data points. 8 stations. 3.2 seconds to load in a browser.
Zoom from 24 hours to 10 seconds instantly. No downsampling.
How it works: typed arrays + GPU rendering.
👉 https://t.co/tMWZRzOwyQ
#LightningChart#JavaScript#WebGL#Performance
Continuous waveform logging. FFT spectrum. 2D and 3D spectrograms. Billions of data points.
LightningChart® .NET includes a dedicated SignalTools library - built specifically for vibration analysis applications.
.NET and JavaScript. 30-day free trial.
👉 https://t.co/wwBbdMahIk
ECG. EEG. EMG. SpO2. Blood pressure. All streaming simultaneously.
LightningChart® handles multi-channel medical monitoring at full precision — GPU-accelerated, no downsampling, 8 billion+ data points in real-time.
JS, .NET, Python.
👉 https://t.co/tVR3tARXKp
#MedTech
100+ live, interactive LightningChart® JS examples. Running in your browser right now.
ECG dashboards. 3D surfaces. Audio spectrograms. Motorsports telemetry. Heatmaps. All with full source code visible.
No signup. No download.
👉 https://t.co/AvG2LKoQTv
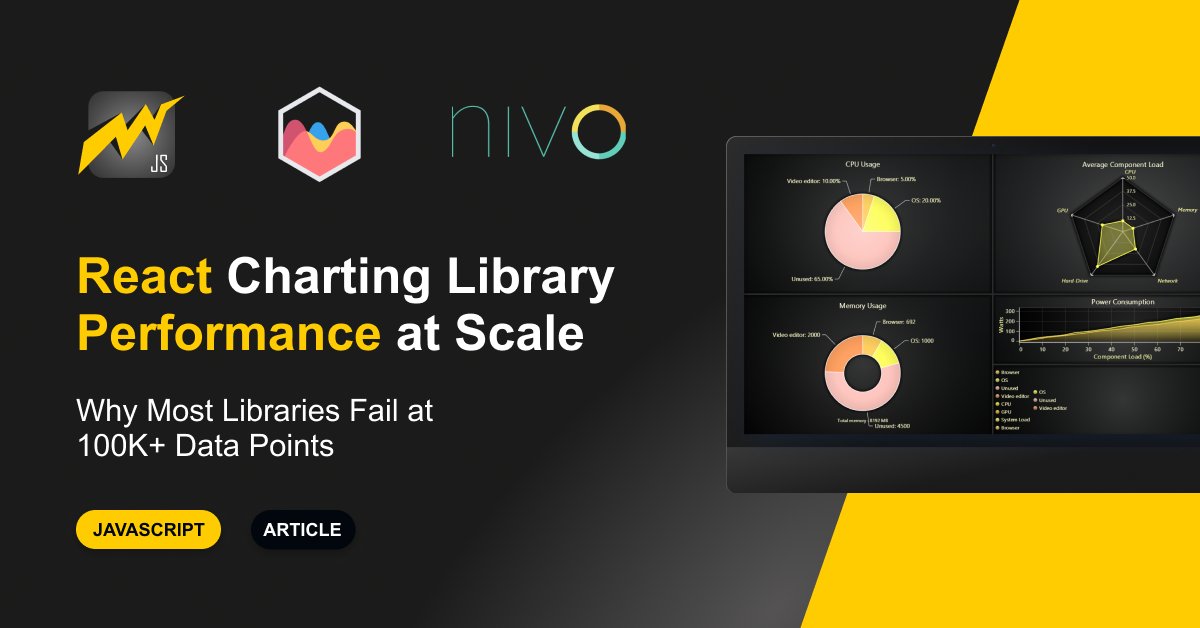
React chart benchmarks at 100k data points:
LightningChart® JS: 60 FPS, 45MB
react-chartjs-2: 22 FPS, 180MB
Recharts: 5 FPS, 620MB
Victory: 4 FPS, 680MB
At 1M points: 4 of those 5 crash.
Architecture explains it all. Full guide: https://t.co/5hok98IZOs
LightningChart® is NATO-registered (NCAGE A970G). Real-time radar, RF spectrum analysis, satellite telemetry, LiDAR. GPU-accelerated. Air-gapped environment ready.
When the data is mission-critical, the charting library has to be too.
👉 https://t.co/jivgktL5AS
#NATO#Defense
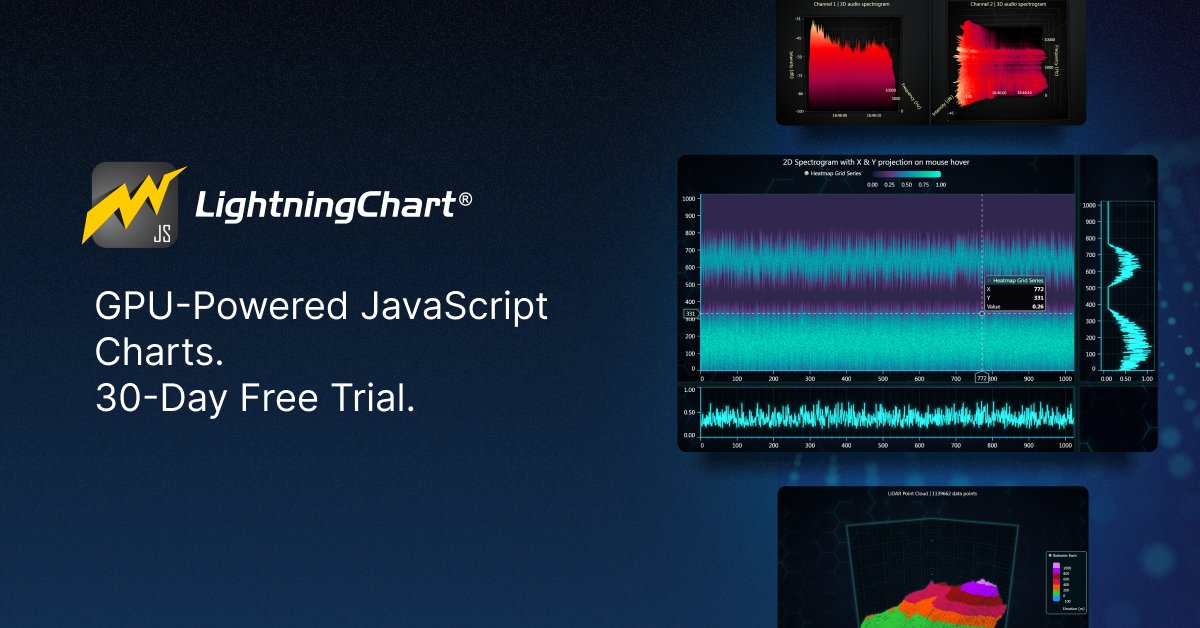
LightningChart® JS: 30 days free. No watermark. No feature gates. No credit card.
GPU. WebGL. 100+ chart types. 60 FPS live. React, Angular, Vue.
Bring your actual dataset - that’s when it gets interesting.
👉 https://t.co/3QXU7jq0oi
Oil & gas data never stops. Pipeline flow rates, reservoir pressure, seismic signals — continuous, dense, unforgiving.
Most charting libraries sample it. LightningChart® renders all of it - GPU-accelerated, 2D & 3D, no ceiling.
👉 https://t.co/qeSfJ0SSIE
LightningChart .NET v12.6.1 is out 🚀
⚡ .NET 10 support
📊 Universal-Data-Parser: drag-and-drop WPF dashboards, no code
🎨 Custom-colored lines up to 100x faster
📈 5 new indicators in .NET Trader
https://t.co/6a3vqNTEwv
#dotnet#csharp#WPF