Strong plant-mycobiome #phylosymbiosis emerges in a super cool common garden experiment. The authors made a synthetic mycobiome, exposed it to 38 species of host prairie plants, and VOILA. Do the hosts choose the fungi, or do the fungi choose the hosts?
https://t.co/bfKmhxgsu4
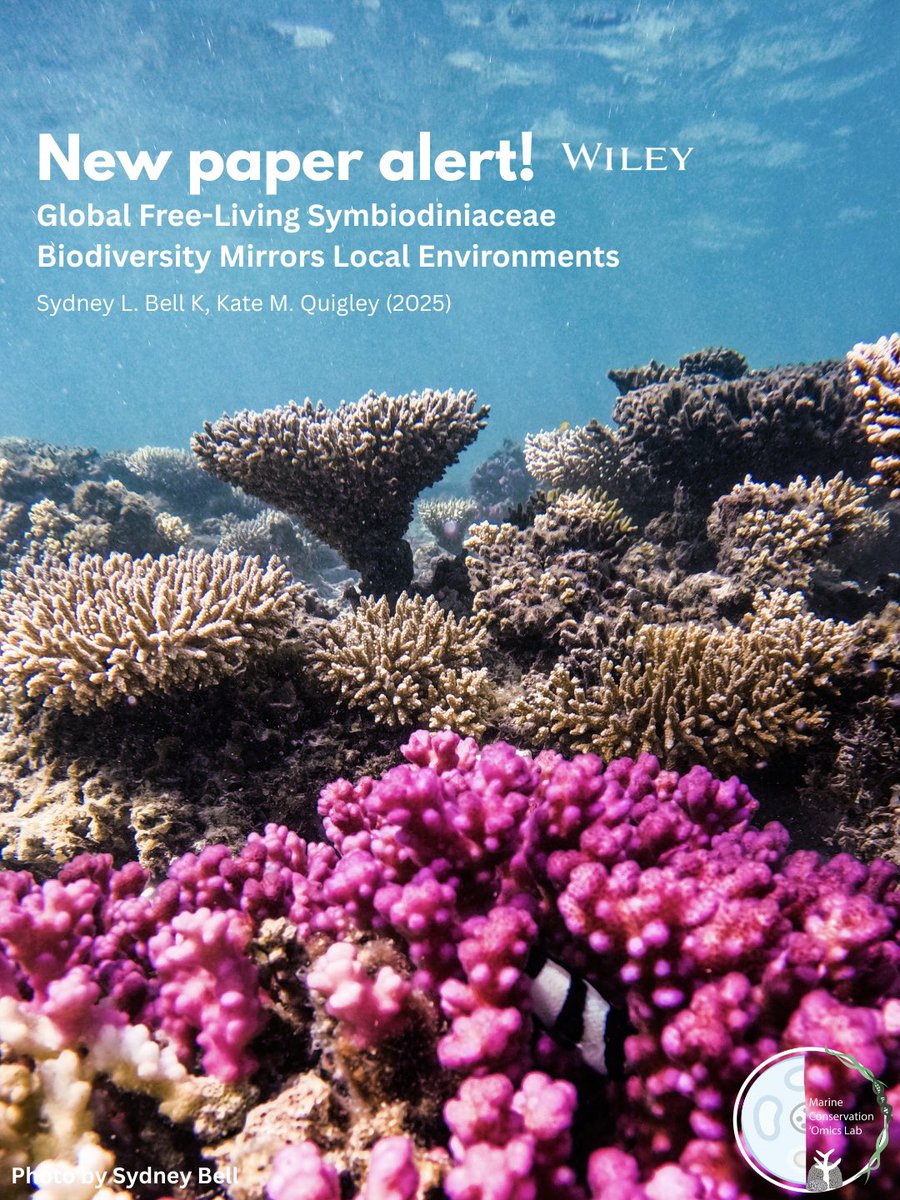
Global patterns of free-living Symbiodiniaceae biogeography 🌏parallel local-scale and in hospite symbiont community structures🪸
First chapter of my PhD thesis with @la__cientifica is now published! https://t.co/qp8mkJCxPt @jcu
The #tidyplots paper is now published in @iMetaScience 🎉🥳🔥
Whenever you use tidyplots in your published work, consider citing https://t.co/n58lCO3Epv 🙏
#rstats#dataviz#phd
Looking to create stunning, data-rich maps in R? The tidyterra package makes it simple to integrate spatial data with ggplot2, bringing the power of the tidyverse to geospatial analysis. With tidyterra, you can work with spatial data just like any other data set in ggplot2.
✔️ Ease of Use: Simplifies map creation by integrating with ggplot2, using familiar functions and syntax, which reduces the complexity of working with spatial data.
✔️ Flexible Visualizations: Supports a variety of geospatial formats, allowing you to combine spatial data with other data sets, and work seamlessly with both raster and vector data.
✔️ Efficient Data Handling: Leverages dplyr-like functions for filtering, summarizing, and joining, which streamlines data processing and enables smooth integration between spatial and non-spatial data.
✔️ Beautiful Maps: Create detailed, customizable maps with less code and more flexibility, using the grammar of graphics you already know from ggplot2.
The visualizations shown here are taken from the package website and demonstrate how tidyterra simplifies creating detailed maps using ggplot2: https://t.co/s6TmHyj0oc
If you’d like to learn more about ggplot2 and how to create stunning visualizations, check out my online course on “Data Visualization in R Using ggplot2 & Friends!” Learn more by visiting this link: https://t.co/ztlEzoEDWv
#VisualAnalytics #tidyverse #DataAnalytics #ggplot2 #Rpackage #DataScience #Data #DataVisualization
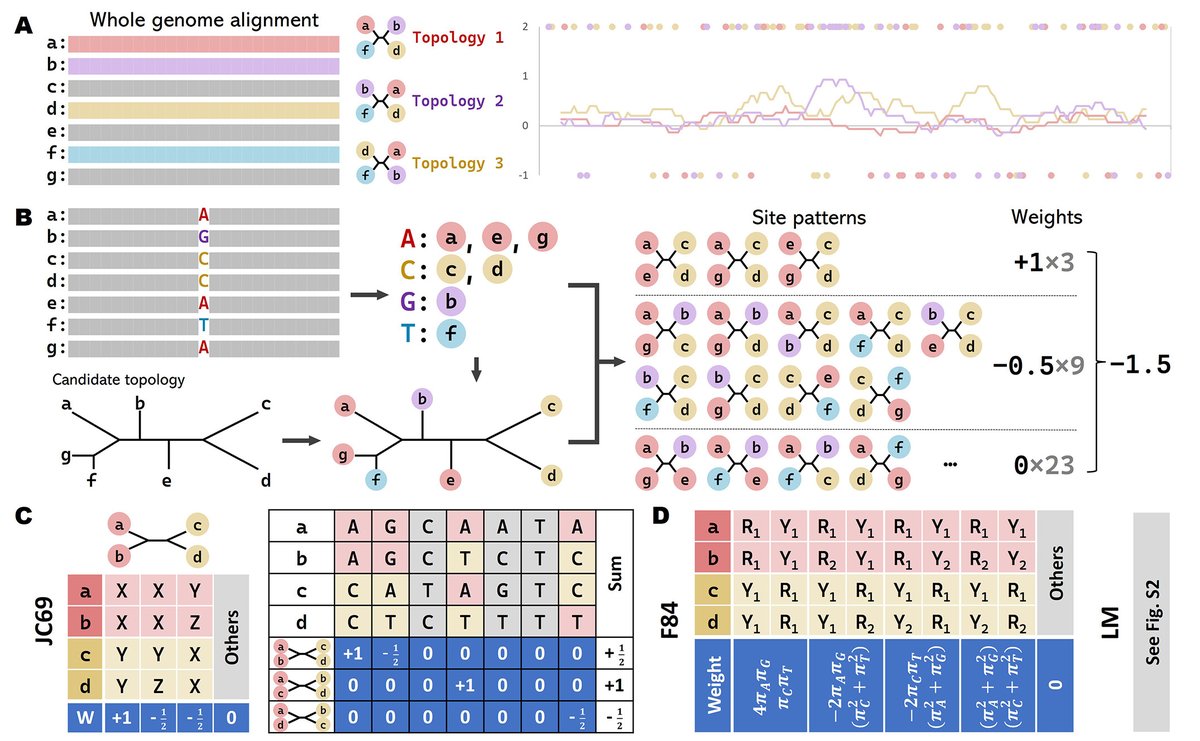
In a new Science study, researchers present CASTER, a tool that uses arrangements in DNA sequences known as site patterns to infer “species trees,” which are diagrams that depict the evolutionary relationships among species.
The tool offers transformative potential for evolutionary research. https://t.co/ZFvoCif1aD
Heat-Evolved Microalgae (Symbiodiniaceae) Are Stable Symbionts and Influence Thermal Tolerance of the Sea Anemone Exaiptasia diaphana #symbiosis#holobionts https://t.co/DXt3Z609aT
Allee effects require corals to lie within a few metres of their neighbours to achieve successful fertilisation. https://t.co/YXsOS7yuTE open access @GerardRicardo01 @ChrisDorop@PICRCPalau
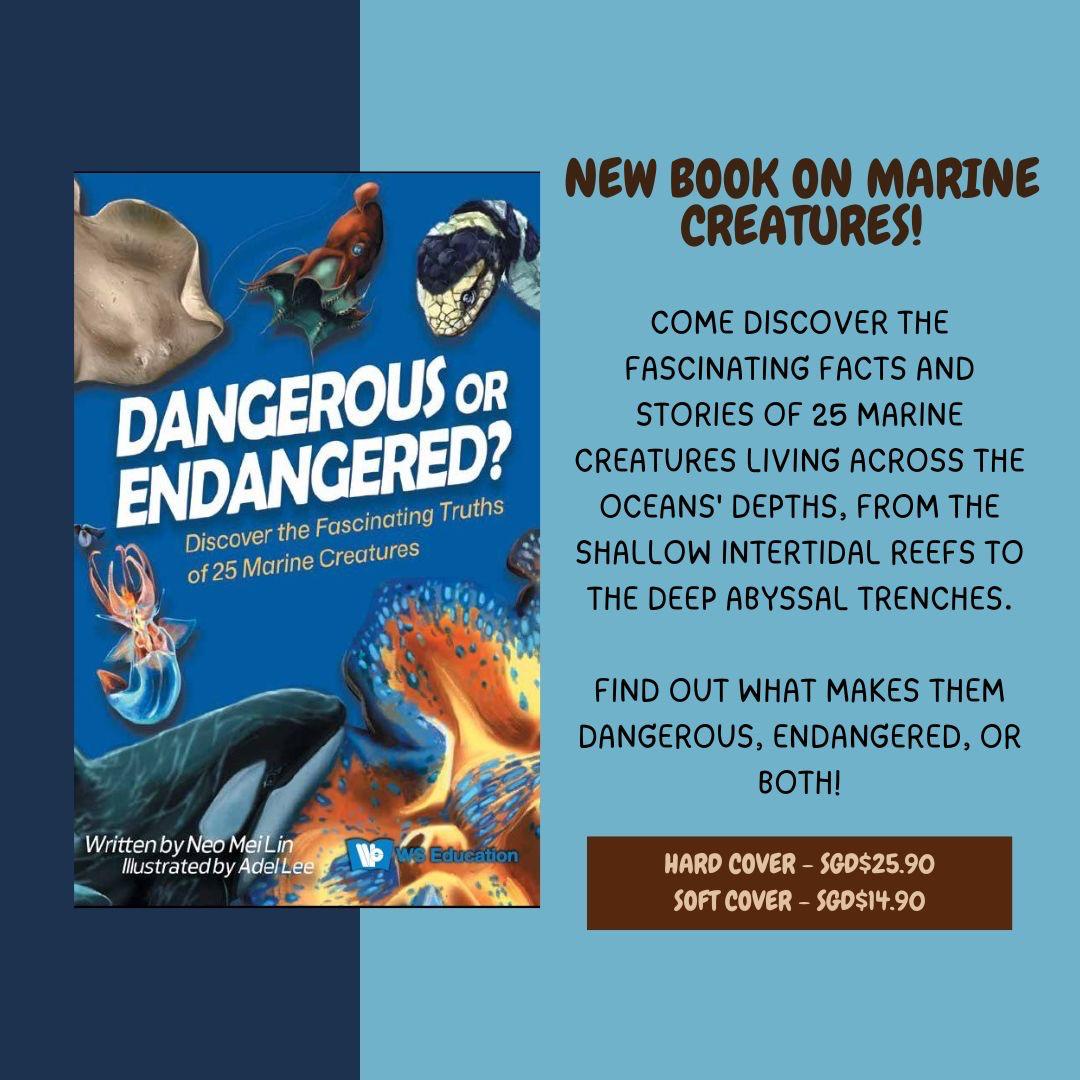
🥳Celebrating the publication of my new book - DANGEROUS OR ENDANGERED?🥳
Come discover the fascinating facts and stories of 25 marine creatures living across the depths of the oceans. Find out what makes them dangerous, endangered, or both! #scicomm
https://t.co/DvQOFZ7kCh
In addition to applied statistics, I have another repository on Data visualization: "quick data vis" (https://t.co/87bQt5Ac6z). It used to be under "Online_R_learning" but now has its own repository on GitHub. I have used this content to teach 1st year grad students for 3 years.
📢New Paper Alert📢
on corals and climate change in @ScienceMagazine
Adaptation via natural selection could determine whether Acroporacorals persist under expected levels of global warming
Hyperlinks & explainer thread below ⬇️
(1/12)
This is the next big thing in reef science coming sooner or later, and I’m betting on sooner!!
Thoroughly encourage anyone to click the link and take a look🔬Soon making high res 3D models of large scale reef sites will be standard for these habitats 🪸
@ICRSCoralReefs and the organizers of @ICRS_2022 from @BremenUni established a new award to support green strategies for coral reef-related events. Each year (2024-2028) up to $10,000 will be awarded to the host institutions organizing such events. See https://t.co/vTNcZem2Wp
Nets, cage traps and a RM250 fine for feeding to curb pigeon overpopulation in Penang. A child had contracted psittacosis, a disease mainly associated with pigeon droppings, & was diagnosed w inflammation of the brain. https://t.co/QfsxGNtiU8
#Onehealth#pigeons