Worked the last few days mostly on my Auto-Fib code!
Optimized it a lot and increased it's performance by 2-3x and accuracy/filtering too!
This will be only added to the alert version, so you won't see it visually.
At the end it will be just an option as confluence to filter out Setups.
Especially nice for Scalpers!
It can also do Multi Fibs, where when you have a multi FVG BB, it will draw fibs in both direction and can check if both line up, which is one of the strongest setups out there. More so for scalping too!
And you will have the option to not only use GP, but also 705, 786 and 886 fibs.
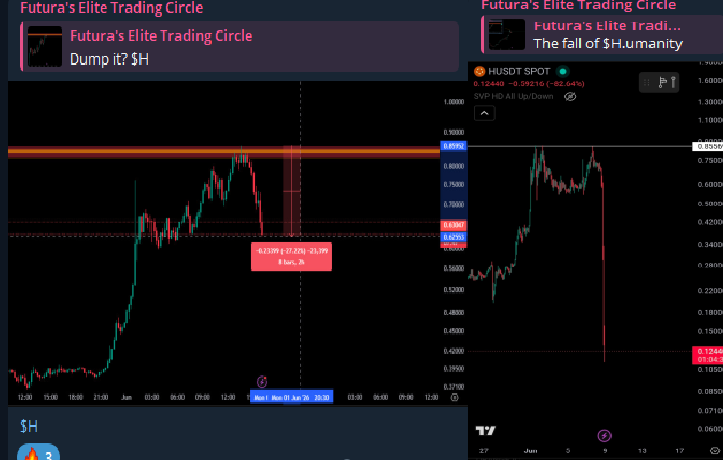
Interestingly enough, they call it a hack.
They call it insiders in the team...
Even though there was only ever one price these assets can ever top at, and; they touch into those exact prices, and levels, and then dump, every, single, time...
On schedule, when, and where they always would.
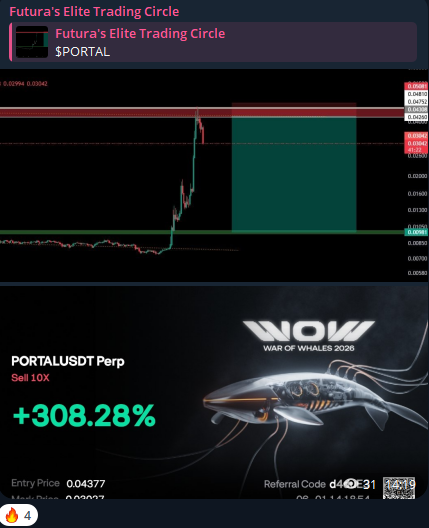
It, is no matter if the asset is $PORTAL, $H it doesn't matter if the product is Chinese, or even if it's a small launch with a $2MN MC, and 50 holders...
The same systems run all of global financial markets.
Automatically.
Systems, I decode.
Or maybe I'm in their teams and simply a market insider.
Thanks for playing...
Explainer Video of all the Settings of Hiddentrades - Hidden Liquidity Finder
It's quite a long one (44 minutes), but wanted to touch on everything important!
If you have any questions or suggestions let me know!
Giving away 3 Beta access:
just Like, RT and Comment!
Overview with timestamps:
Core Detection & Filtering
[00:30] History:
Controls how many past candles the script checks (capped at 10,000). Lowering this number significantly speeds up the script's loading time.
[01:32] BB Formation Window:
Sets how many candles into the future the script will look to see if an order block converts into a breaker block.
[02:25] Partial Mitigation:
Defines the percentage an order block can be pierced by price action before the setup is considered fully mitigated and invalidated.
[04:48] Use ICT OBs:
Enforces stricter ICT (Inner Circle Trader) rules. It requires the displacement to have three consecutive confirmation candles moving in the opposite direction.
[06:48] Allow Two Candle Impulse:
A modifier for the ICT setting that reduces the required displacement confirmation from three candles down to two.
[07:39] Only Show Multi-TFs:
Cleans up the chart by hiding single breaker blocks, displaying only the stronger multi-timeframe setups.
[08:13] Early BB Detection:
Allows breaker blocks to confirm and form directly on the next candle after the displacement, helping you spot setups earlier.
Order Block & Gap Configuration
[09:30] Strict OB Filter: Makes pivot order blocks stricter by validating the height of the specific displacement candles surrounding the block.
[11:24] Requires Same Direction Candle:
Ensures the candle immediately preceding the order block is moving in the same direction, creating a true pivot point.
[12:18] Use Wicks for Pivot Detection:
Uses the extremes of the candle wicks to calculate the pivot low/high, rather than relying strictly on the candle bodies.
[13:16] OB Candle Color Filter:
Adds a strict color requirement to the candles forming the order block to ensure it perfectly aligns with traditional definitions.
[14:08] OB Side Mode (Pivot vs. Chain):
Allows the script to follow a continuous chain of fair value gaps (FVGs) rather than strictly requiring a perfect pivot setup.
[16:13] Displacement Candle Setup:
Explains how the script handles displacement candles that open directly inside the order block (common with market gaps).
[17:17] Allow Gaps to Create a Breaker Block:
Very useful for trading stocks with pre/post-market price jumps, allowing the physical price gap itself to serve as a valid trigger.
[18:42] Body Size Filtering:
Allows you to set a minimum percentage size for order blocks, with separate inputs for lower, middle, and higher timeframes.
Time Frame (TF) Selection Modes
[20:07] Auto Mode:
Automatically searches up to 20 timeframes above and 20 timeframes below your current chart to find setups.
[22:10] Auto From Selected:
Uses the auto-search logic, but strictly limits the search to the specific timeframes you have manually checked off.
[23:49] Selected Only:
Scans exactly the timeframes you select, regardless of the timeframe you are currently viewing on the chart.
Visual & Chart Display Settings
[25:04] Merge Nearby Breaker Blocks into Clusters:
Combines multiple overlapping or nearby zones into one clean, unified cluster zone.
[27:27] Show Order Blocks Inside Cluster:
Hides isolated single order blocks, only visualizing those that contribute to a larger multi-timeframe cluster.
[29:03] Distance Filter:
Instantly hides any setups that fall outside a set percentage range (e.g., 10%) from the current market price.
[30:01] Show Forming Breaker Blocks:
Displays upcoming setups in a faint gray color before the final confirming candle has officially closed.
[31:52] Hide Mitigated BB Always:
Automatically removes breaker blocks from your screen the moment price action fully mitigates them.
[34:10] Show Recently Deleted Breaker Blocks:
Keeps failed or mitigated blocks visible in gray for the last 240 candles — an excellent feature for backtesting.
[36:03] Text Offsets:
Adjusts the padding of the text labels so they sit cleanly away from the chart blocks without overlapping.
[37:39] Merge Overlapping Labels:
Intelligently combines the text labels of two nearby breaker blocks into a single centered tag to prevent visual clutter.
[39:23] Colors and Opacity:
Customizes block colors and automatically fades the opacity of lower-timeframe blocks while keeping higher-timeframe blocks solid and prominent.
[41:32] Bold Text Label:
A simple toggle to bold the chart labels for easier reading.
After taking the sweep of $80k, taking the 🔑 in the integer system at $81k with slight deviation. (Minor front run of exact favourite levels) https://t.co/Emq0o7zxY8
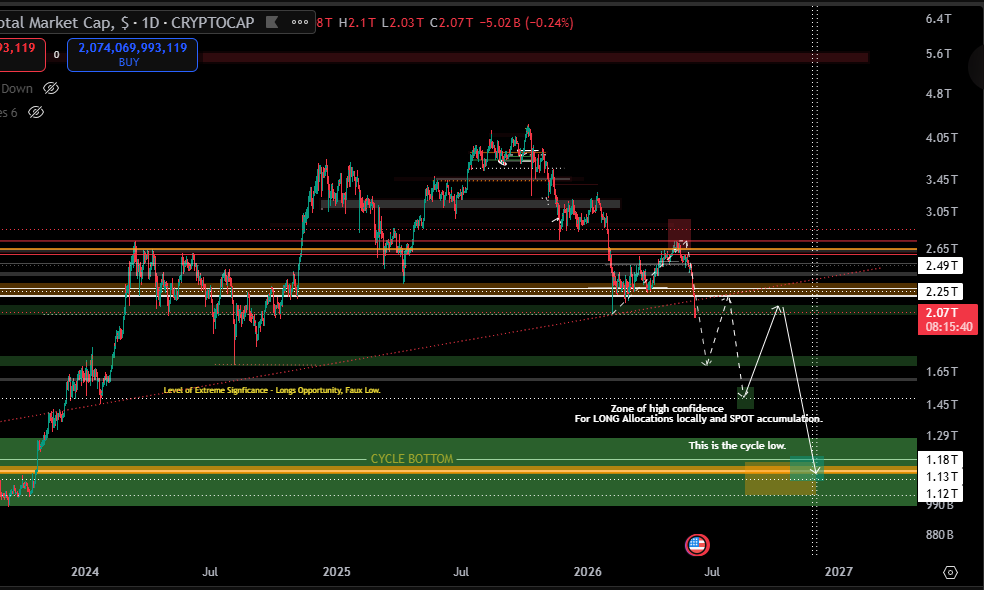
We now look for HTF Zones of accumulation, where to be buying, times, zones of interest as we are in the latter half of downturn, it is wise to become increasingly bullish as time goes on, and as price goes lower. The majority of traders are reactive, monitoring sentiment, narratives and psychology and so the majority of traders will not understand why specific levels will, or won't arrive. The truth is, all of these ideas are completely irrelevant.
I study the algorithm, and that is my only focus.
As time continues, more capital swathes to the automated machines, and it becomes even more automated to the same definitions.
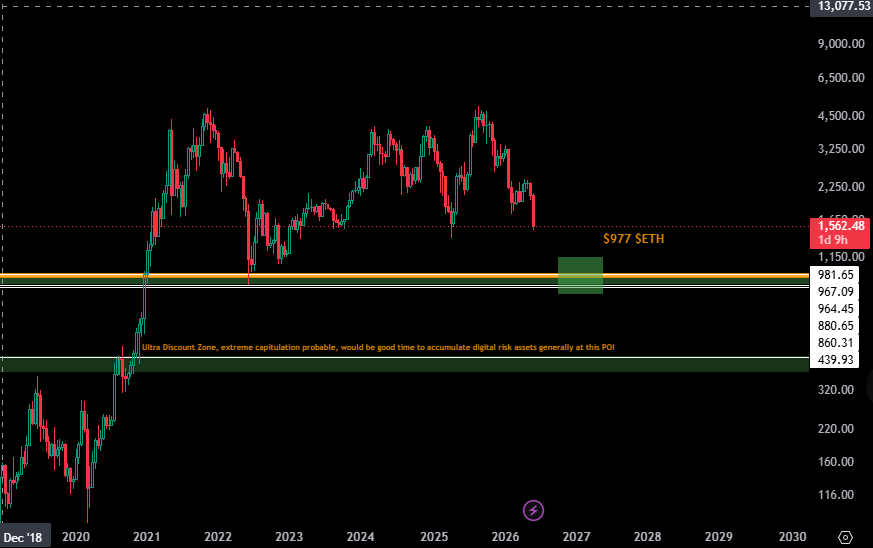
My zones of extreme interest are as follows for HTF accumulative lows, $TOTAL respectively at around 1.12T-1.18T, $ETH checking a minor sweep of $1k (Although Data at specifics will be refined closer, $1.3k also valid accumulation); and, $BTC by definition having the focus of attention, to have various powerful bottoms over the latter part of this year.
It must be accounted for that gamble like trading, high leverage positions and a sentiment of 'make it now', as well as psychological deteriation in long term thinking, due to fast media and social algorithms makes trading as a industry change.
Many have lost a lot in the prior cycle, misreading or hyper attuning to local price's/media attention. What this means is, coming into the expected 'cycle' lows, we will have even more desperate capital attempting to aggressively long macro lows.
Conclusion is we will have multiple convincing macro lows over the next 5-8 months with potential decent alt runs in various sectors in the meanwhile, before repeatedly getting swept and dusted.
Sentiment engineering must remain somewhat bullish-capitulatory-bullish-capitulatory for this to happen.
I will tell you now, that how I approximate levels. There is no final low until $28k is touched, whether this be in 2027, or 2026. I'm currently very much liking the idea we have strong macro lows in the latter half of 26', Q4, potentially as soon as July/August, from higher levels than $28k, somewhere in the $30k-$40k ballpark and for the industry to bounce off these levels bullish, maybe for what seems like long enough for 'confirmations of the low being in'.
... before we sweep that zone of final hope and bring in pure capitulation, complete disinterest in the industry, acknowledgment of how it is designed to redistribute wealth from the masses, to the rich and move interest elsewhere, leaving crypto behind as a failed industry.
I'm really liking the idea of a true, final low being put in at $25k-$28k in Q1 2027. Before then, many powerful bottoms, some decent runs and confusion, before repeated capitulations.
₿rave.
We're arriving into the next levels, times, prices, again. After pico shorts on $ETH...
For months, I have been waiting for these $80k levels, telling you, here, price would be arriving, and price is falling into our palms. 🪤https://t.co/XU8yDwcwb8
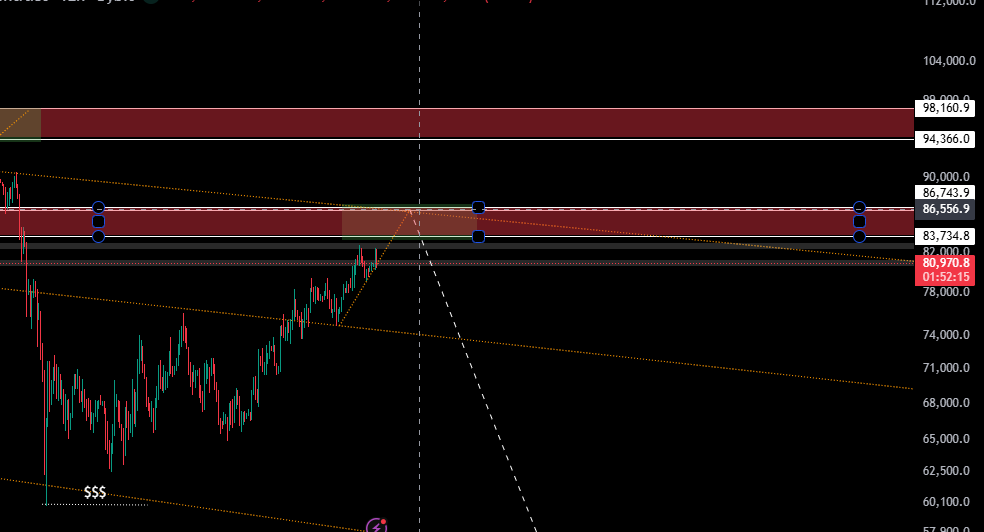
I have a mathematical integer system that is still being tested in real time, pattern symmetry suggests, if we do a exact repeat of the prior move to $97.5k,
then $86.5k exactly would be the rejection point, there-on indicating a full % completion of this move for the algorithm, allowing us to continue our downwards trajectory, with no automated capital engines propping up price.
There are a few nice levels above however, based on traditional TA, $83.7k (My aforementioned), the $86.5k, and also the $88.7k, levels, all are of strength of equivalence.
And I will be looking to add to my short at each zone.
Just as a few months ago, was the time to buy, here we are nearing that time to sell.
And of course, when the time is right, I will fly the signal. Just as I have been doing for these past years.
https://t.co/1loGNa4Ogy
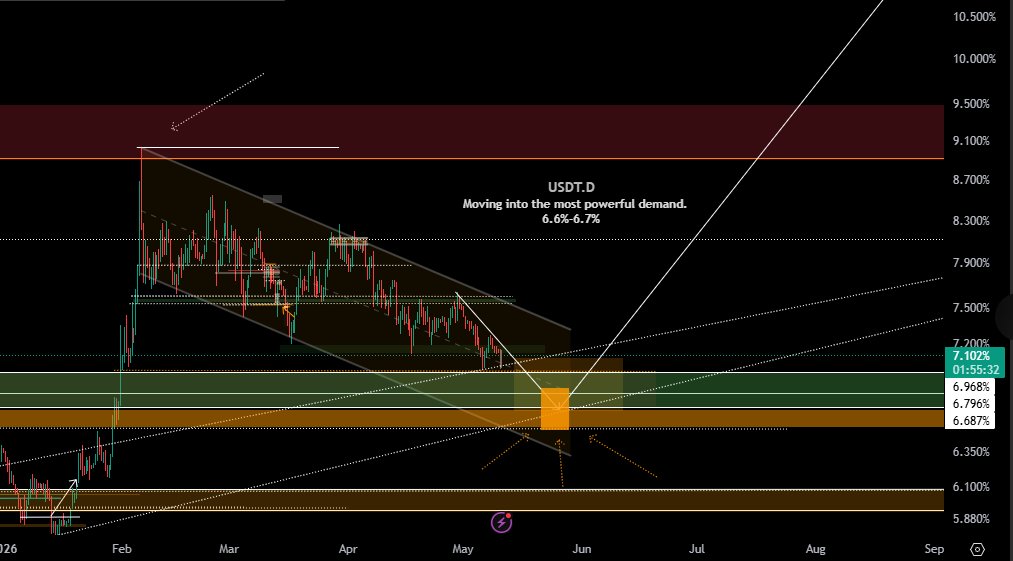
The USDT.D Zone at 6.6%-6.7% provides us our strongest confluence, it will be a circumstance of aligning confluences, as, and at the time to see clearly which level is defined as our pico level, and whether the integer system proves to be correct ($86.5k). I still maintain I very much like the $83.7k I have been waiting for https://t.co/6G7Tunseig and I will still begin my sizeable scaling at that level.
I have just had the arrival of my first born child, so I have been away for a little of some time with him this past week, as the pico trigger gets closer, and closer, you will hear from me.
As you have come to know I do as always...
₿rave.
The shorts in this thread have already been made risk free positions, after projecting the 22nd April 🎯high pivot, as well as taking pico shorts on 17th April, I look to the next move. The shorts I have taken will be held from current highs, in the case we have no upswing.
I'm looking at a scenario of something akin to this over the coming weeks as a nice scenario, with a rally early May sweeping our highs, taking sitting liquidity above us for a final manipulatory short capitulation, placing a high on the 16th May.
Two levels of interest sit above to me, $83.7k and $87.2k, in the which case we arrive at those levels, I will 🔨 them heavily, again...
For this scenario to play out, I'd like a rejection from local levels (as of time of writing, around low $78k) with a invalidation above the 22nd April high.
I will come back to this over the coming weeks.
We are giving away 4 free subscriptions to SixOneEighters.
4 winners. 4 months free access each.
To enter:
🔹follow us
🔹repost this post.
Winners announced in 72 hours.
From traders, for traders.
#SixOneEighters#TradingJournal
Moneytaur timestamped the macro top range years ago, right after the 2021–22 bear market bottom.
A long while before the macro top hit, that projected range was tightened into a possibility of seeing the 120s. Reasons were given. Then came the pico-top and i was exiting longs and taking shorts. Sold a lot of ETH and alts before the wreckage.
Shorted BTC in the 120s, rode into the 80s. Public. Timestamped, closed, and then prepared to buy back on spot once the levels i shared and updated several times hit. Time will tell if i took another good decision or if i'll pay gains back if i didn't time it as accurately this time around.
As conditions evolved, expectations were adjusted in real time, shared openly, well before price confirmed them. No edits. No hindsight. No disappearing acts.
More recently, Moneytaur clearly stated spot re-accumulation. Again public, simple, verifiable.
If i've been quieter lately, it's for two reasons:
1] I don't farm engagement. My forecasts are already on the table, and the latest macro one avoided major losses to who decided to sell and short alongside me, against the euphoric CX herd.
2] I'm traveling, living, and enjoying the proceeds of good decisions, often funded by the same people who hate out of jealousy, so thank you for your service.
For some, the hardest truth isn't price, but comparison. Knowing that thousands voluntarily gather here as a community, while they stand alone, unheard, called out, earning in a year what i make in a week, if that.
What's left are desperate attempts to cherry-pick non-optimal sub-scenarios, pretending they invalidate forecasts whose time windows are still active. That level of tunnel vision only exposes panic, frustration, depression.
Most of the haters are gone, dead. Mental collapse is one of the most common outcomes of getting completely wrecked in this game.