Hi Everyone
I identify as Mide a Business Intelligence Analyst "MideTheAnalyst" and in this thread I'll be spotlighting a few analytical dashboards I have built over time
Each one turning raw data into clear insights and stories
As a Business Intelligence Analyst, I have worked on transforming complex datasets into actionable insights, building interactive dashboards, and uncovering trends that support smarter decision-making 🔻.
Here I analyzed a dataset containing modelled data about the video game market and helped identify top-performing titles and markets:
- Top game: Call of Duty: Black Ops II
- Top region: North America (₊43% of global sales)
- Top console: PC with The Sims 4 leading
- Critic score correlation showing higher ratings drive stronger sales
- Publisher insights: Activision, Ubisoft, and EA dominate
This put my data visualization and market intelligence skills into play, and I showed game analytics isn't only about player counts but requires understanding regional, platform, and publisher dynamics.
Hi Everyone
I identify as Mide a Business Intelligence Analyst "MideTheAnalyst" and in this thread I'll be spotlighting a few analytical dashboards I have built over time
Each one turning raw data into clear insights and stories
As a Business Intelligence Analyst, I have worked on transforming complex datasets into actionable insights, building interactive dashboards, and uncovering trends that support smarter decision-making 🔻.
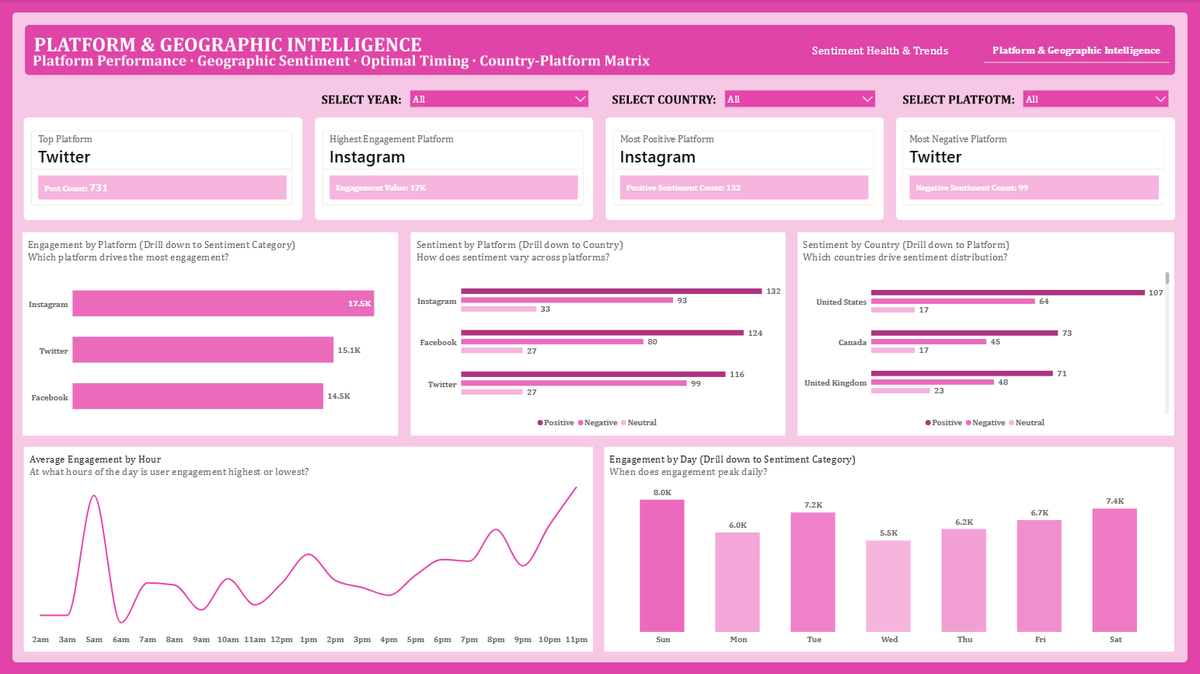
For this social media intelligence project i analyzed a sentiment & engagement dataset and helped brands understand audience behavior:
- Platform performance with Instagram leading engagement
- Sentiment distribution across Twitter, Facebook, Instagram
- Geographic insights from US, Canada, UK audiences
- Optimal timing showing peaks at 3am & 11pm
- Emotional drivers like joy, excitement, and gratitude
This put my analytics storytelling and digital strategy skills into play and i showed social listening isn't only about tracking mentions but requires contextual interpretation and timing awareness.
@vheeorji22 There's actually no correlation. Excel uses formulas, Power BI uses DAX. Excel is just a more accessible entry point, so people learn it first, then move on to SQL before tackling visualization in Power BI or Tableau which can also be done in Excel as some people prefer
@vheeorji22 I don't think it’s the certificates that get you the job. You have to show real projects, build a portfolio that proves your skills, and demonstrate how you solve problems with data
@DAME_Academy@ezekiel_aleke One thing I wish I’d learned earlier is the power of storytelling with data. Early in my career, I thought sharp analysis alone was enough but the real impact comes when you can frame insights in a way that resonates with decision-makers
@Femiforge The real win is when you take that solution, understand it, and fold it into your own skill set so you don’t trip over the same problem again. That's not cutting conners
@Femiforge I think every possible digital skill you can think of. You just have to apply it consistently, spot the real-world opportunities, and keep sharpening it until it becomes your edge. The difference isn’t the skill itself it’s how you leverage it in practice
@DabereNnamani Happy Friday Miss Annie
One thing I picked up this week is how powerful data storytelling can be not just presenting numbers, but weaving them into a narrative that makes people care and act. It reminded me that analytics isn’t just about precision, it’s about impact
@stellaanalyzes Absolutely, tools can crunch numbers, but it’s critical thinking, clear communication, and asking the right questions that turn raw data into real insight. Without those, even the most advanced software is just noise
What products, pharmacies, and promotions are truly driving profitability Additionally, which hidden trends might be putting future revenue at risk?
These questions drove my latest project where I analysed a pharmacy sales dataset using SQL on Postgres.
The goal was not merely to store sales data but to transform fragmented transactional records into a structured analytical system.
This system helps decision-makers understand performance, identify growth opportunities, and proactively manage risks to profitability across a pharmacy network.
I began by designing a dimensional data model built around a central sales fact table connected to key business dimensions: Date, Pharmacy, and Product. This foundation allowed business activity to be viewed from multiple perspectives instead of relying on isolated reports.
Once the structure was in place, the real exploration began where I posed the questions that business leaders ask daily:
• How has revenue evolved over time?
• Which pharmacies are generating the strongest financial performance?
• Which product categories and brands contribute the most to growth?
• Are promotional campaigns actually increasing revenue?
• Which countries and regions demonstrate the strongest demand?
• Which products are experiencing margin declines that could threaten future profitability?
As I explored each question, new layers of insight emerged.
Some pharmacies generated impressive revenue but revealed lower profitability than expected. Certain product categories consistently outperformed others, highlighting areas for potential expansion. Promotion analysis showed the impact of marketing activities on sales, while product-level margin analysis helped identify areas where profitability was quietly eroding.
One of my favorite aspects of the project was analyzing declining product margins.
Instead of solely celebrating top-performing products, I focused on identifying those whose profitability was trending downward, and by comparing current margin performance with prior-year results i was able to highlight products that could become future risks if left unaddressed.
These insights helped the business shift from reactive reporting to proactive decision-making.
Beyond the technical implementation, this project reinforced an important lesson: Data becomes valuable when it helps answer business questions.
While building tables, writing queries, and creating views are important skills, the real impact comes from translating data into decisions that improve performance, reduce risk, and create strategic clarity.
This project not only strengthened my SQL development skills but also enhanced my ability to think like a business analyst, connecting data structures to real-world business outcomes.
Read project documentation on GitHub: https://t.co/VRup7Rf4MX
#SQL #DataAnalytics #BusinessIntelligence #DataWarehouse #AnalyticsEngineering #DataAnalysis #PostgreSQL #BusinessAnalytics #DataProjects #PortfolioProject