1/16
The Chart of the Century: Gold vs Dow
For 100 years, the Gold/Dow ratio has traced an expanding triangle (ABCDE).
We are now in Wave E — the terminal phase.
➡️ Elliott Wave target:
• Gold $20,000–$25,000 base case
• Silver $300–$500 (potentially >$1000 in mania)
• Gold/Dow ratio aiming for 20x from here, possibly retesting Upper trendline or a bit throwover
It seems unbelievable today. Bookmark this , in 10 years you’ll see how obvious it was.
The reset decade has begun. #Gold #Dow #ElliottWave #Reset #Markets #Macro #ChartOfThecentury
Yes, that is the third layer.
I don’t think it is the “end of fiat” overnight.
It is more likely the slow loss of confidence in fiat as a store of value.
Central banks and BRICS+ nations are buying gold because gold has no counterparty risk and a sanction proof asset.
The system still run on dollars for liquidity.
But reserves are slowly moving toward gold for trust.
Both Gold and the Dollar can rise together.
Most people think it is impossible because they only look at one simple rule:
Dollar up = Gold down.
But that is not always true.
The real question is not whether the Dollar is rising.
The real question is why the Dollar is rising.
If the Dollar is rising because of higher rates, higher real yields, and a hawkish Fed, then Gold usually struggles.
That is a rate-driven Dollar rally.
But if the Dollar is rising because of a global rush to safety, dollar shortage, credit stress, banking pressure, EM stress, or financial instability, then Gold can rise with the Dollar.
Because in that setup, both are being bought for different reasons.
The Dollar is bought for liquidity.
Gold is bought for trust.
The Dollar is the emergency cash of the system.
Gold is protection from the system itself.
That is the key difference.
A war that creates only inflation fear can push the Dollar higher and Gold lower, because markets start pricing higher rates.
But a crisis that creates financial instability can push both higher, because investors need Dollars immediately, while also looking for safety outside paper claims.
And in my view, we are definitely going to see this setup play out in the coming years.
A stronger Dollar and stronger Gold will not be a contradiction.
It will be the signal that the world is moving from confidence to stress.
Even when sentiment is bad, Chinese SHFE silver futures are trading at $75.82, close to an $11 premium to COMEX.
That premium says a lot about the underlying physical tightness in silver.
@Shaw14962888677 This is not a bull post, sir.
Physical tightness continuing even during bad sentiment is the perfect setup for the next big squeeze when the setup comes.
Crude oil looks ready for a short-covering up move.
The recent selling has become extremely stretched.
Price was pushed aggressively lower inside the descending channel, and even slipped below the lower end of the channel.
But the important point is this:
It could not sustain below the channel.
That failed breakdown tells us sellers may have exhausted themselves near the lower extreme.
When price breaks below a channel and immediately starts getting absorbed, it often signals that the move is no longer fresh selling — it is emotional, late-stage selling.
This is where shorts become vulnerable.
Crude is now trading near a key support zone from the previous breakout structure, while downside momentum is slowing.
So the risk-reward is shifting.
Fresh shorts here are late.
And reclaim back into the channel, followed by strength above the recent breakdown zone, can trigger a fast short-covering move.
My view:
Crude oil may be setting up for a sharp relief bounce from here.
The broader correction is still valid, but the immediate downside looks overextended. Sellers had their chance below the channel and failed to hold it. That failure itself is the signal.
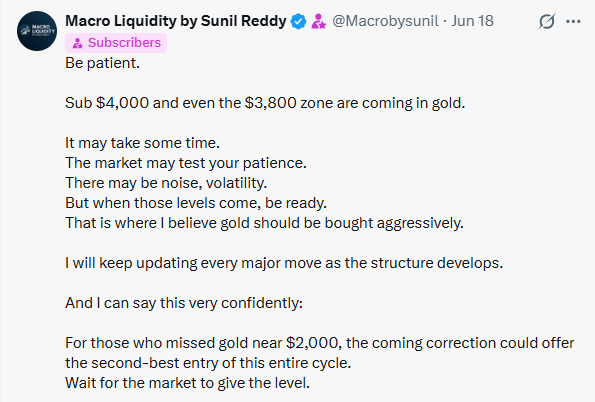
When will Gold and Silver bottom again?
The answer is not on the Gold chart.
It is in the US 2-Year Yield and Dollar Index.
Gold and Silver are highly sensitive to front-end yields, and right now the 2Y yield is still looking strong.
I would expect at least a move toward 4.45% before it starts forming a proper top.
That means short-term pressure on Gold and Silver can continue for a few more weeks, especially As DXY is also stays firm.
But this is not the phase to panic.
The real bottom signal will come when the 2Y yield and Dollar Index both start showing topping/reversal structure.
Until then, I am treating this weakness as an accumulation window.
By the end of this pressure phase, I expect to be fully deployed in Gold and Silver.
USD/JPY is about to hit a new high.
The second-order effects will be felt very soon.
160 is not just a number.
It is a politically sensitive level for Japan.
Once USD/JPY moves above that zone, Japan will be almost forced to intervene.
To defend the yen, Japan has to sell dollars and buy yen.
And those dollars come from reserves.
A large part of those reserves are parked in U.S. Treasuries.
So yen weakness can quickly become Treasury selling.
Treasury selling pushes yields higher.
Higher yields pressure equities.
Equity pressure hits risk appetite.
And then the same carry trade that looked like free money becomes the trigger for turbulence.
First USD/JPY breaks higher.
Then Japan intervenes.
Then Treasuries shake.
Then equities feel it.
The second-order effects are coming.
@PrateekGoe42996 Agreed. The system in place is the most brutal to the people who save in fiat in japan, it's a day light robbery named as monetary policy.
In 2011, one of the biggest gold discoveries in modern history happened inside a temple in India.
Not inside a central bank.
Not inside a sovereign vault.
Not inside the Federal Reserve.
Inside the vaults of the Anantha Padmanabhaswamy Temple in Kerala.
Estimates suggest the treasure could hold nearly 3,000 tonnes of gold equivalent.
That is around 96 million ounces of gold.
To understand the scale:
That is more gold than the official reserves of almost every central bank on earth individually.
More than China (official numbers).
More than Russia.
More than France.
More than Italy.
More than India’s own central bank reserves.
Only the U.S. and Germany officially hold more.
Gold is not just another commodity.
It is the asset civilizations store when they want wealth to survive beyond governments, beyond currencies, beyond wars, beyond empires and beyond banking systems.
Paper wealth needs a system to protect it.
Gold protects itself.
It can sit silently in a vault for centuries.
And one day, when the world rediscovers it, it still has value.
That is the significance of gold.
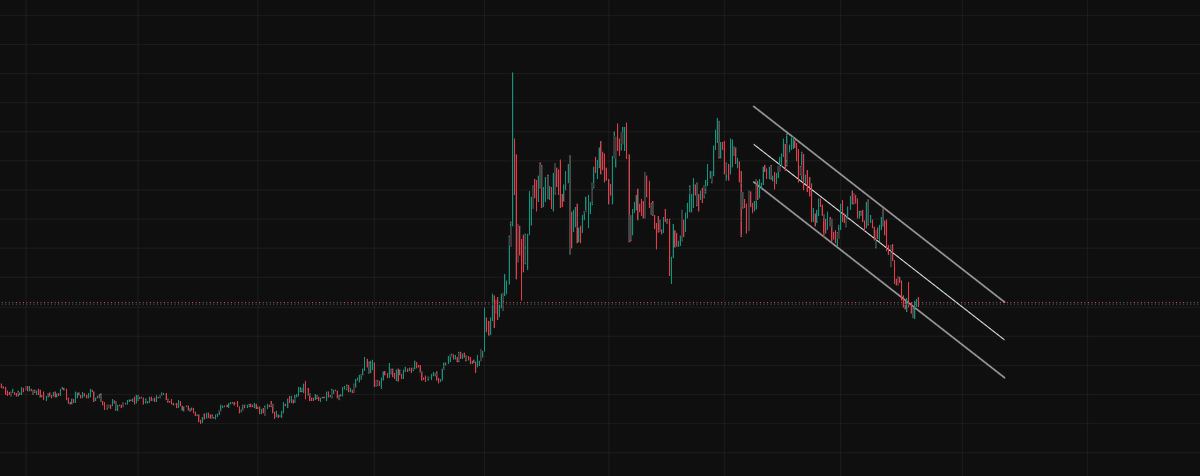
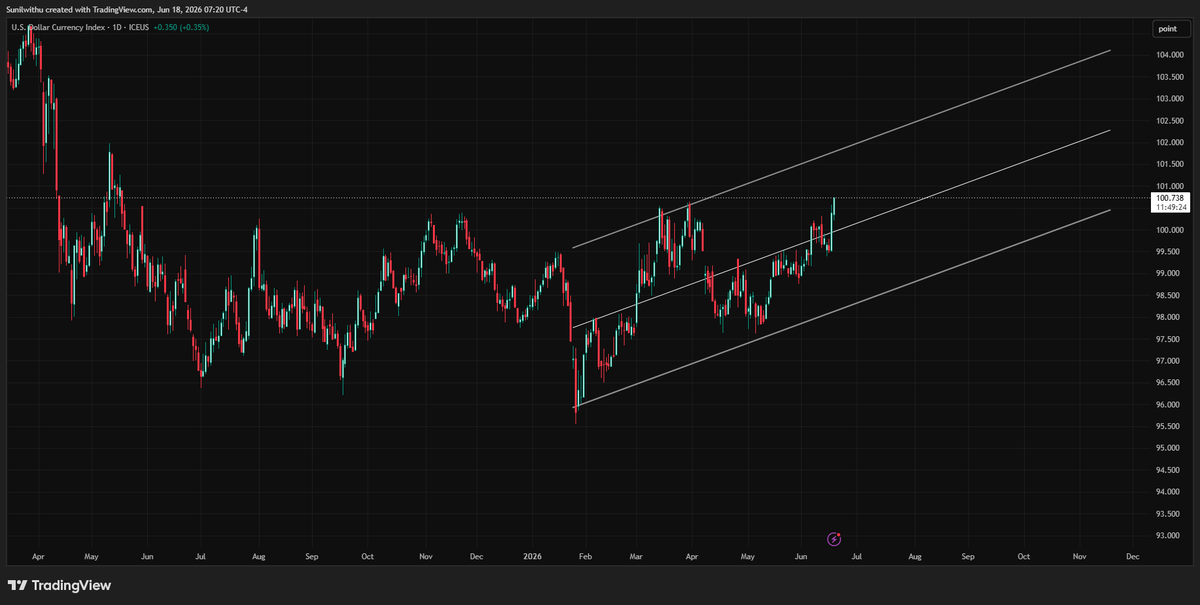
Dollar Index is showing exceptional strength here.
At this pace, a test of 102 looks like the minimum target, unless the market behavior changes quickly.
The reason is simple.
Rate Hike expectations are increasing.
Yields are rising.
And the move is being led by the short end, especially the 2-year.
That combination is a direct headwind for gold.
A spike in long-end yields alone is not always the biggest problem for metals. But when the short end starts strengthening, it means the market is pricing tighter policy .
That truly affects gold.
So until the bond market changes its behavior, gold can remain under pressure.
But I am not worried about this structurally.
Strong rates always look powerful in the beginning.
Then they start damaging growth.
Then something breaks.
Then the same Fed that talks tough is forced to capitulate.
Gold may face pressure now.
But this is how Bear phase ends and the next bullish phase gets built.