🚨 [MACRO OFFICIAL STATEMENT] Nobody is talking about it
Headlines are looking in the wrong place.
The real move from the Trump administration isn’t a speech.
It’s a plumbing lever that can rewire #Treasury demand overnight: SLR reform.
But the sequence starts earlier:
- 🌍 US #equities are underperforming ex-US by ~5% YTD (widest since at least 1995). And 2025 already saw the S&P lag MSCI World ex-USA by ~12.4pp.
- 📈 Yet #earnings aren’t collapsing: Q4 EPS tracking ~+11% YoY vs ~7% expected. So why is leadership changing while fundamentals look fine?
Because the market is sniffing multiple compression + dollar regime risk (DXY vs EM equities correlation ~-0.40).
Then the physical world shows up:
- ⛏️ Zero major gold discoveries for two consecutive years (first time ever). Global money supply growth ~12.3%. Gold support to watch: ~$4,400.
And the economy is flashing a warning:
- 🚚 #Transportation job cuts at recession-like levels: 31,243 cuts in Jan 2025, driven by UPS planning up to 30,000 cuts.
The #yield curve has been positive for 14 months and is at the highest level in 4 years.
Cuts aren’t automatically bullish (2000–2002: -9.1%, -11.9%, -22.1%).
So what’s the “bazooka” nobody is pricing?
🏦 SLR reform.
- SLR forces banks to hold capital against Treasuries (because Treasuries consume balance sheet).
- If Treasuries get exempted again - like during the pandemic - estimates suggest ~$5.5T of bank #balance-sheet capacity could be freed.
That would mean: #banks become the marginal buyer of Treasuries → QE becomes less inevitable → USD can firm → gold/Bitcoin can get shaken → positioning gets punished.
Is the next regime funded by the Fed… or by bank balance sheets?
In my latest PRO piece I deep-dive in:
- 📊 The US vs ex-US rotation and why it’s not “just noise”
- 📉 Why strong EPS can still produce flat returns (2018 template)
- 🥇 Scarcity + liquidity = why gold keeps coming back
- ⚠️ Why bonds can fail as the default hedge in fiscal dominance
- 🏦 The SLR mechanism - and how it could quietly change everything
connecting:
→ relative performance breakdown
→ earnings strength vs de-rating risk
→ real-asset scarcity
→ the hidden Treasury funding lever
If you want the mechanism behind the move - not the headlines - don’t miss this.
Read my latest PRO analysis👇
https://t.co/snFjNzfNz2
MARKET UPDATE 🚨 The 30-year just broke a line that held for 18 years
5.18%
That is where the US long bond closed on Friday - the highest monthly close since June 2007.
The horizontal resistance drawn from the 2007 high across the 2023 peak has now broken cleanly. No retest. No mercy.
Here is what the math now demands 👇
• Annual US debt service is running at ~$1.2 trillion, ~3.9% of GDP - the highest debt service to GDP since 1991.
• Every additional 25bp adds ~$78B to interest cost at maturity rollover.
• A move to 6%, where the technical breakout projects, drags debt service through $1.5 trillion.
• That is larger than the entire defense budget.
• Last time the 30Y broke a multi-decade line (1981), the S&P fell 27% over the next 12 months.
The 2007 peak at 5.41% sat 4 months ahead of the S&P top. The analog window now lines up squarely with September-October 2026. 📉
When duration repriced like this in 2007, IG spreads went from 96bp to 618bp. Today IG sits near 92bp. Same setup, different ending? 🧠
#macro #bonds #yieldcurve #rates
I've been tracking every move of this 30-year breakout and my latest article breaks down exactly what it means for credit, equities and the dollar - and which assets are positioned to absorb the next leg.
🔗 (subscribe to my newsletter here @MacroMornings)
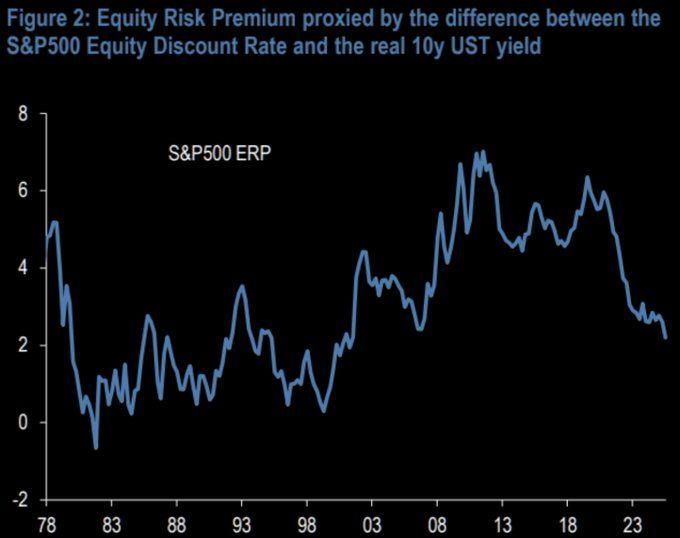
MARKET UPDATE 🔎 Are investors still being paid to own US stocks?
The S&P 500 Equity Risk Premium just fell to the lowest level in more than 20 years.
The extra return you receive for taking equity risk over the risk-free rate has been crushed to levels last seen before the dot-com top.
Here's what the chart is screaming:
• Earnings yield on the S&P 500 has converged toward 10-year Treasury yields
• ERP is sitting near zero - and at moments, negative
• The last time we were here, the next 10 years for equities were brutally flat
• Every prior episode (2000, 2007) ended with a sharp regime change
• Bonds, cash, and selective international equities are quietly becoming a better risk/reward
So the question isn't "is the S&P expensive?" - that's obvious.
The real question is how long can multiples keep expanding when the fundamental compensation for owning stocks has already evaporated?
For a deeper understanding of what's really happening read my latest article.
🔗 (subscribe to my newsletter @MacroMornings)
#bonds #yieldcurve #Fed
MACRO UPDATE 🔎 If stocks are at records, why do 76% of Americans say the economy is getting worse?
Gallup's latest, and it's brutal 👇
• 76% of Americans say economic conditions are getting WORSE
• Only 20% say they're getting better
• Highest "getting worse" reading since May 2023
• Spread between optimists and pessimists is back to recessionary levels
• All of this while S&P 500 just printed a new all-time high 📉
So either the consumer is finally about to capitulate to the tape… or the tape is about to capitulate to the consumer. Which one breaks first? 🧠
Want to understand what comes next for the US consumer and markets?
🔗 Subscribe to the newsletter @MacroMornings and do not miss my latest articles.
#macro #recession #inflation
LATEST 🤯 S&P 500 at an all-time high. Consumer Sentiment at an all-time low. We've never seen this gap.
It used to be that markets and households moved together - when stocks ripped, sentiment confirmed it.
Now it's the widest dislocation ever printed.
Wall Street today:
• S&P 500 at fresh record highs
• Mag-7 weight pushing 40% of the index
• Risk-on positioning back near cycle extremes
• Volatility crushed back below long-term averages
Main Street today:
• Consumer Sentiment at an all-time low
• Real wage growth turning negative again
• Credit card delinquencies at decade highs
• Savings rate back below pre-COVID levels 📉
What changed: liquidity, multiple expansion and AI-driven concentration are doing all the heavy lifting at the index level - while the underlying household economy quietly deteriorates. 🧠
When the index disconnects this far from the people who actually consume what those companies sell, the gap usually closes one of two ways - and rarely the comfortable one.
Want to understand what comes next for US equities and markets?
🔗 Subscribe to the newsletter @MacroMornings and do not miss my latest articles.
#macro #recession #liquidity
BREAKING NEWS 🚨 Global long bond yields just punched through their highest level since the 2008 crisis
4.2%
That's where the Bloomberg Global Long Bond Index yield is sitting right now - the highest reading since July 2008.
Translation: the cost of long-duration sovereign debt is back at GFC levels, only this time the world has $100T+ more leverage on top of it. 🏦
What's driving it 👇
• Fiscal deficits widening across G7 economies 📉
• Sticky services inflation refusing to roll over
• Term premium re-pricing as buyers demand more compensation for duration
• Energy prices elevated and stuck
When the entire long end of the global yield curve breaks out, every risk asset eventually has to repriced against a new discount rate. ⚠️
I've been covering exactly this setup.
🔗 (subscribe to my newsletter on @MacroMornings)
#macro #bonds #yieldcurve #liquidity
BREAKING NEWS 🚨 The 2nd-most-expensive US stock market in 150 years just printed.
37.9
That's the current Shiller P/E10.
+114% above the 150-year mean of 17.7. Only one reading in the entire historical record has ever been higher: March 2000 at 44.2.
📊 Where this print sits across history:
• 1929 peak: 32.6 → +84% above mean
• 1966 peak: 24.1 → +36% above mean
• 2000 peak: 44.2 → +149% above mean
• 2007 peak: 27.5 → +55% above mean
• 2021 peak: 38.6 → +118% above mean
• Today: 37.9 → +114% above mean
Readings beyond +2 standard deviations have occurred in just ~3.4% of all monthly observations on record. We are statistically in the right tail of the entire 150-year distribution.
The market is not "a bit rich." It is priced exactly like every prior cycle-ending top.
#valuation#macro#equities
Also in the cross-asset return distributions starting from each of these historical peaks something big just emerged.
Full breakdown in my article 👇
https://t.co/zLW7wzUK2g
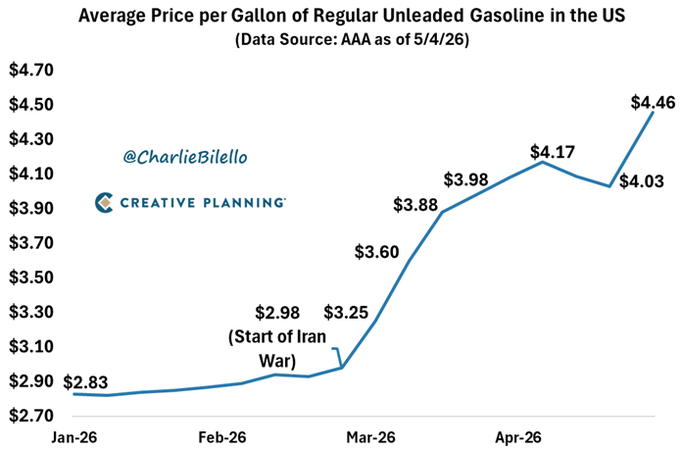
HAPPENING NOW 🚨 A leading market historian just flagged the most uncomfortable inflation chart of the year.
"+50% in 9 weeks - the biggest US gas price spike in 30 years."
🇺🇸 The "transitory" word is back at the gas pump.
⛽ US gas price → $4.46/gallon, highest since July 2022
🧠 Move over 9 weeks → $2.98 → $4.46, +50%
�� Spike size → biggest in 30 years
📊 CPI implications → base effects flip from disinflation to re-inflation
🚗 Consumer impact → direct hit on real disposable income
🔥 Fed read-through → harder to justify deeper cuts into year-end
Now connect the dots 🔗
🇺🇸 US - discretionary spending wobbles ahead of holiday season
🇸🇦 Saudi Arabia - voluntary cuts plus tighter shipping margins
🇮🇷 Iran / Strait of Hormuz - geopolitical risk premium back in
🇪🇺 Europe - diesel and gasoline cracks pressuring real income
🇨🇳 China - strategic petroleum reserves topping up
Inflation didn't end. It just changed costume. ⏳ #inflation #Fed #macro
For a deeper understanding of what's really happening read my latest article.
🔗 Subscribe to the newsletter (link in my profile Alessandro S.) and do not miss it.
UPDATE 👀 At these yield levels, what exactly are you being compensated for?
When the S&P 500 dividend yield sits at its lowest level in nearly 150 years, what is the implicit bet under every dollar of equity exposure?
• Dividend yield has only dropped below 1.5% twice in modern history: 2000 and now
• Sub-2% yield + >1.5% real yields → 10-year forward return averages just +3% to +4%
• Long-run average: +9% to +10% annualized
• MSCI Brazil yields 7%+ - more than 4x the S&P 500
• From the March 2000 peak, S&P 500 fell -49% while MSCI EM gained +69% over five years.
If the next decade looks anything like the decade after 2000, which map do you want to own - the one starting from adoration, or the one starting from neglect? ⏳
#macro#dollar#centralbanks#inflation
For a deeper understanding of what dividend-yield extremes mean for forward returns, read my latest article.
🔗 Read it here: https://t.co/VYBrXnhmlS
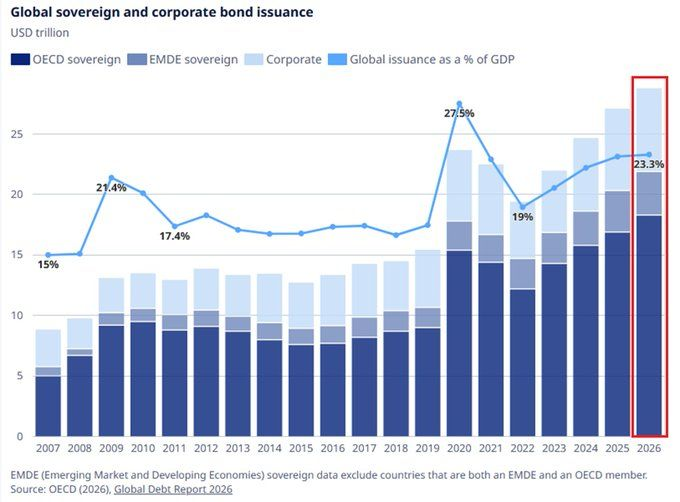
MACRO UPDATE 🚨 It used to be a crisis measure. Now it's the baseline.
It used to be: "$15T of global debt issuance is a pandemic emergency." Now it is: "$28.8T is a Tuesday."
Then (pre-pandemic average)
• Global issuance ~$14T/year
• Government debt growth roughly in line with GDP
• Corporate debt issuance "opportunistic"
• Debt/GDP ratio treated as a ceiling
Now (2026E)
• Global issuance at a record $28.8T
• Government debt alone at $21.9T, all-time high
• Corporate debt at $6.9T, all-time high
• Issuance at 23.3% of GDP - 2nd-highest reading ever
What changed: fiscal dominance is no longer a thesis, it's the operating system.
Why it matters: every duration model calibrated on the old regime is now stale.
I've been covering exactly this setup. Read my latest article (names, numbers, and strategy inside).
🔗 Subscribe to the newsletter (link in my profile @MacroMornings) and do not miss it.
#macro #bonds #Fed #liquidity
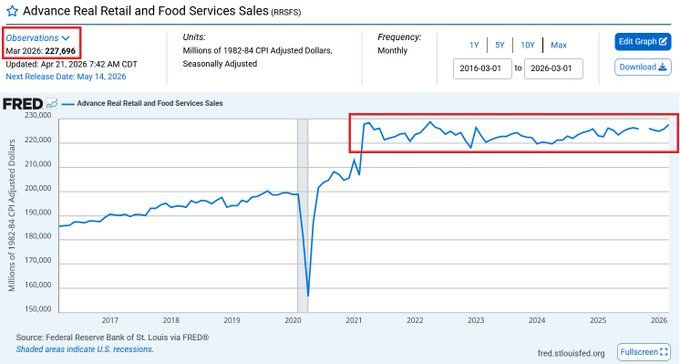
MARKET UPDATE 📊 Five years of zero real progress in the US consumer
That is how much real US consumer spending has actually grown in the last 5 years, once you strip out price inflation.
Retail sales printed +1.7% MoM in March, above the +1.4% consensus… but the hook was hiding in plain sight.
• Gasoline spending surged +15.5% MoM (price, not volume)
• Real retail sales are flatlining vs 2020 levels
• Nominal growth is flattered by higher prices, not stronger demand
• The consumer is running on a treadmill while the data screams "resilience"
This is what nominal illusion looks like: headlines up, purchasing power stuck.
Want to understand what comes next for the US consumer and markets?
Subscribe to the newsletter (link in my profile @MacroMornings) and do not miss my latest articles.
#macro #inflation #recession
BREAKING NEWS 🚨 The map of global energy trade didn't stay where it started
The Strait of Hormuz was always the single most important chokepoint for oil.
Eight weeks into the US-Iran war, ~800 vessels are still trapped in the Persian Gulf, unable to transit.
The IMO is now drafting an evacuation plan.
This is no longer a shipping story. This is a supply-chain re-pricing event.
Country by country, the chessboard is being redrawn:
🇮🇷 Hormuz shut → every barrel out of the Gulf is now a political barrel.
🇸🇦 Ships stranded → physical differentials blowing out in Dhahran & Ras Tanura.
🇶🇦 LNG cargoes bottled up → European and Asian buyers scrambling for replacement molecules.
🇺🇸 Strategic influence expanding → Washington is pricing freight risk, not just oil.
🇨🇳 Biggest buyer of Gulf crude → now the most exposed importer on earth.
🇪🇺 Already short on jet fuel and diesel → 6 weeks of buffer is melting fast.
🇯🇵 Energy-import dependent → rerouting via longer, costlier tanker miles.
Freight rates are the new inflation gauge.
Tanker day-rates, LNG shipping, war-risk insurance premiums - all of it is feeding back into CPI before the Fed can even react.
How do you hedge a world where the chokepoint is also the supply?
The next map of global energy is being drawn right now. 🌍
#macro #commodities #inflation #centralbanks
I've been covering exactly this setup. Read my latest article (names, numbers, and strategy inside).
🔗 Subscribe to the newsletter (link in my profile @MacroMornings) and do not miss it.
NEWS FLASH 🚨 +$86B in 5 sessions, +$70B projected, top-5 ever recorded.
🇺🇸 CTA flows just printed one of the most violent mechanical bids on record 💰
📊 The Numbers (last 5 sessions)
• +$86B of global equities bought by CTAs
• +$70B of additional mechanical demand projected on a flat tape
• Ranks top 5 on record for rolling-week CTA purchases
• Three-month forward S&P 500 return in analogs: +8.18% average
• VIX compression in those windows: -20% to -25%
⚡ Where It's Coming From
• Trend slope has flipped bullish across equity indices
• Realized volatility has compressed to multi-month lows
• Systematic leverage has re-levered toward cycle highs
• Flat-tape projection still prints aggressive mechanical demand
CTAs are not betting on fundamentals. They lock in:
➡️ Trend-following exposure across S&P, Nasdaq, Russell
➡️ Short-vol positioning through equity futures
➡️ Duration shorts as 10Y drifts higher on risk-on
This is landing while:
🇺🇸 The S&P 500 dividend yield sits near 150-year lows
🇨🇳 EM central banks keep accumulating gold at a record pace
🇪🇺 ECB policy divergence keeps FX carry unusually wide
This is what a mechanical squeeze looks like. 📈
#macro #liquidity #yieldcurve #dollar
Want to understand what comes next for CTA flows and equity positioning?
Full breakdown in my article 👇 https://t.co/VYBrXnhmlS
JUST IN 🇺🇸 The US wage gap just broke a record - and the macro consequences are bigger than the headline 💰
🚨 +5.6% vs +2.0% vs +1.0%. Top earners, middle, bottom. Widest spread since data began.
📊 The Numbers (March, 3-mo MA Y/Y, after-tax)
• Top-income households: +5.6% Y/Y - highest in at least 3 years
• Middle-income households: +2.0% Y/Y - flat-lining
• Lower-income earners: +1.0% Y/Y - near the lowest in 3 years
• Gap between top and bottom: the widest on record since 2015
• Wage compression is no longer a cyclical story, it is structural
⚡ Where It's Coming From
• AI-driven productivity concentration at the top of the corporate ladder
• Services inflation still squeezing the lower 60% of earners
• Sticky rent and food costs eating real disposable income at the bottom
• Equity and asset-price wealth effects accruing to the top 20%
The consumer is not betting on a broad recovery. It locks in:
➡️ A two-speed US economy where luxury and premium brands outperform
➡️ Persistent core services CPI, tying the Fed's hands on rate cuts
➡️ A narrower, fatter-tail consumption base driving S&P 500 earnings
This is landing while:
🇺🇸 Consumer sentiment sits at an all-time low
🇪🇺 EU household savings buffers continue to shrink
🇨🇳 China pivots to stimulate its own wage cycle
This is what a late-cycle income dislocation looks like - and it rewrites the Fed's playbook.
Want to understand what comes next for the US consumer and markets?
Subscribe to the newsletter (link in my profile @MacroMornings) and do not miss my latest articles.
#macro #Fed #inflation #recession
🇺🇸 MARKET UPDATE 📊 Under the S&P 500 highs - real breadth is finally showing up
🚨 New highs broadening, mega-cap concentration easing, cyclicals re-rating.
The Numbers (last 3 weeks):
📈 Index at fresh record
🏦 Financials: rising share of members at 52-week highs
⚡ Industrials: breadth accelerating on re-shoring and capex
🧠 Tech: still strong but no longer carrying alone
📉 Defensives: lagging - a classic risk-on breadth signature
Where it's coming from:
● AI capex cycle widening into industrials, utilities, power
● Banks repricing on curve plus deregulation expectations
● Global risk-on from Hormuz reopening
The market is not betting on a narrow squeeze.
It locks in:
➡️ Cyclical earnings durability
➡️ Margins holding above pre-war levels
➡️ A Fed staying restrictive, but not breaking growth
This is landing while:
🇺🇸 Credit spreads tight
🇪🇺 Europe catching up on a lag
🇨🇳 EM breadth quietly improving
This is what a breadth-led regime shift looks like.
#macro #liquidity #Fed #rates
I've been covering exactly this setup. Read my latest article (names, numbers, and strategy inside).
🔗 Subscribe to the newsletter (link in my profile @MacroMornings) and do not miss it.
LIVE UPDATE �� The S&P 500 rally didn't stay where it started - it's being imported everywhere
Three consecutive weekly gains of more than 3%, each one bigger than the last - the first time in S&P 500 history.
The US tape didn't stay where it started.
Country-by-country, here's how the shockwave travels:
🇺🇸 Record weekly sequence, back-to-back-to-back prints
🇪🇺 Euro Stoxx playing catch-up, lagging the push
🇬🇧 FTSE dragged higher by energy and mining
🇯🇵 Nikkei re-rating with the weaker yen and export tailwind
🇨🇳 Offshore tech riding the AI liquidity wave
🇰🇷 South Korea already +100%+ y/y
🇸🇦 Gulf markets digesting the oil repricing
The next map is being drawn right now - a world where US equity dominance is not shrinking but compounding through global liquidity.
#macro #liquidity #Fed #commodities
I've been covering exactly this setup. Read my latest article (names, numbers, and strategy inside).
🔗 Subscribe to the newsletter (link in my profile @MacroMornings) and don't miss it.
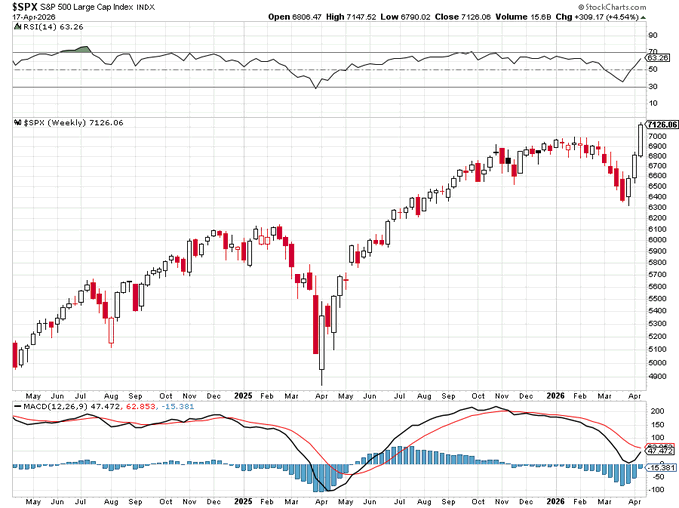
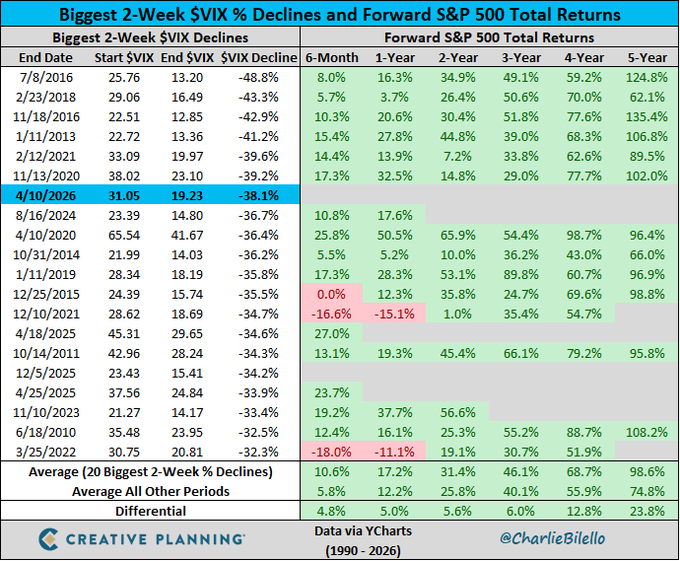
NEWS FLASH 🤯 History says what just happened to the VIX is one of the most powerful buy signals in 35 years of data - here is exactly why
A 38% two-week VIX implosion.
The 7th most extreme volatility collapse since 1990.
And the historical record is emphatic: when the VIX crashes this hard, forward equity returns are overwhelmingly positive. 📊
- The numbers across all comparable events: average 1Y S&P 500 return of roughly +17%.
- Average 3Y
- Average 5Y return approaching +75%.
Only one instance in the top 20 - December 2021 - delivered negative 1Y returns, and that was directly ahead of the most aggressive #Fed hiking cycle in four decades.
Today's setup is the mirror image: the central bank is biased to ease, fiscal spending remains elevated, and corporate earnings expectations are being revised higher.
The Iran war volatility spike created the panic; the VIX collapse is the signal that the panic is being repriced.
The magnitude of the VIX decline matters more than the level.
A crash from 31 to 19 compresses the fear premium in a way that typically coincides with institutional re-risking and systematic strategy re-leveraging.
Both create a powerful demand impulse for equities over subsequent months. ⚠️
The data has spoken. Whether you act on it is a question of conviction.
#macro #recession
🔗 (Do not forget to subscribe to my newsletter - link in my profile @MacroMornings)
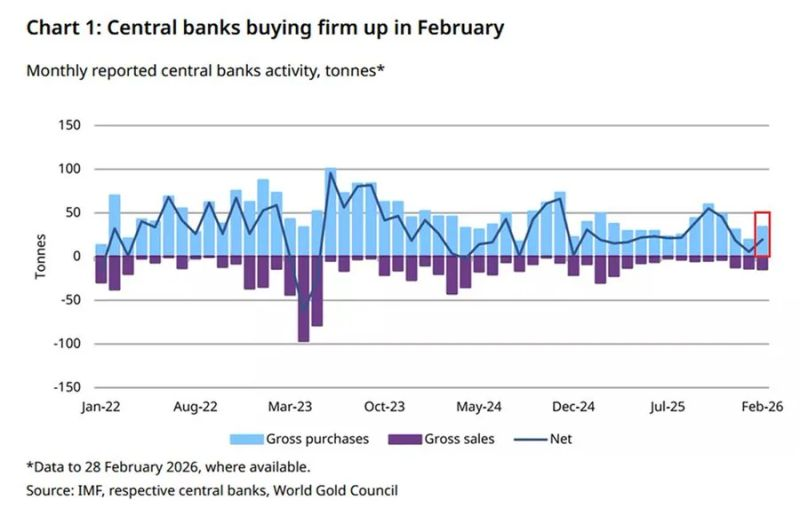
🚨 23 Consecutive Months of Net Gold Buying
Central banks are not slowing down.
+19 tonnes in February
+6 tonnes in January
+25 tonnes YTD
Who's leading:
🇵🇱 Poland: +20 tonnes
🇺🇿 Uzbekistan: +8 tonnes
🇨🇳 China: 16 straight months of buying → 2,308 tonnes in reserves
What's really happening:
- This isn't a momentum trade.
- This is institutional distrust - expressed politely.
Reserve managers are looking at the world and deciding, slowly but deliberately, that the next decade requires assets that exist outside any one country's political promises.
⚠️ 3 signals you cannot ignore:
- Official demand is putting a structural floor under gold
- This is the 23rd consecutive month - behavior, not noise
- The buyers think in decades. Not quarters.
When actors with 30-year horizons all move in the same direction, that's not a trade.
That's a message.
I've been tracking every move of this shift and my latest article breaks down exactly what it means for gold, the dollar, and the entire reserve system.
Read it here: https://t.co/l3PGadgu54
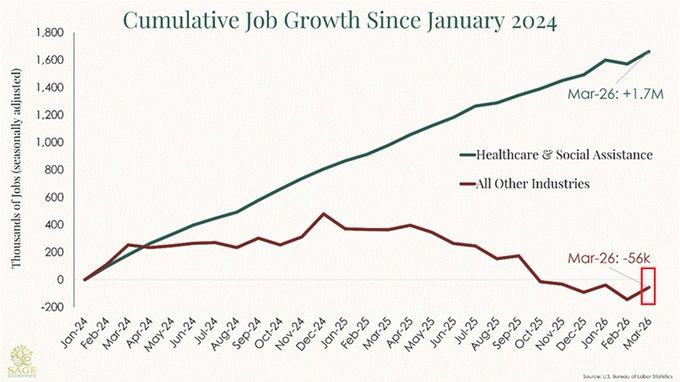
UPDATE 🔴 Remove one sector from the US jobs data and America has been in a stealth employment recession for two years
Here are the numbers that Wall Street is not talking about: since January 2024, healthcare and social assistance has created +1.7 million jobs.
Every other industry in the country? Negative 56,000. Net negative.
That means the manufacturing sector, technology, financial services, retail, construction - all of them combined - have destroyed jobs on a net basis while the Bureau of Labor Statistics prints healthy-looking NFP reports month after month. 📊
The engine behind these healthcare gains is largely government-funded: Medicare expansion, Medicaid spending, ACA-driven demand.
This is not organic private-sector job creation.
It is fiscal policy dressed up as labor market strength.
Why this matters for #rates and #recession risk: if fiscal pressures force healthcare spending cuts - or even a slowdown - the US labor market has no backup generator.
The breadth collapse underneath the headline data is a classic late-cycle signal that has preceded every major downturn in modern history.
The #Fed sees the headline. Smart money watches the composition. Right now, the composition is screaming. ⚠️
🔗 (Do not forget to subscribe to my newsletter - link in my profile @MacroMornings)
BREAKING NEWS 🚨 $2.1 billion just fled energy funds - the biggest weekly outflow in nearly two years
Three weeks ago, energy was the hottest trade on the planet. Investors poured $13.5 billion into global energy funds in just 21 days.
The Hormuz escalation made oil the ultimate momentum trade.
Then, in a single week: -$2.1 billion out the door.
The Kobeissi Letter's chart captures the violent reversal - a cluster of record positive bars followed by a sudden negative spike.
The 4-week moving average is still elevated, masking what could be the start of a larger rotation.
Here is what the smart money is calculating: oil at $100+ is priced for continued escalation.
Any ceasefire headline, any diplomatic channel, any de-escalation signal could trigger a waterfall in positioning.
The outflow is the first sign that some players are not waiting to find out #commodities#liquidity#macro
The crowd was all-in on energy. When the crowd starts leaving, pay attention ⚠️
🔗 (Do not forget to subscribe to my newsletter - link in my profile @MacroMornings)
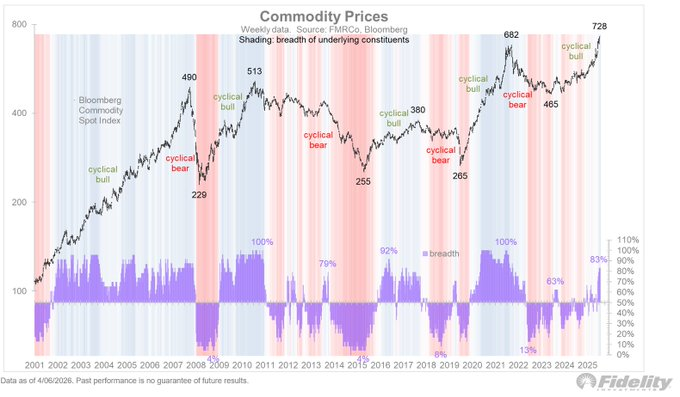
MACRO UPDATE 🌎 Commodities just hit new all-time highs - and it is not just oil driving the move
The Bloomberg Commodity Spot Index has broken out to record levels.
The move is broad-based: 83% of the index components are trading in confirmed uptrends, according to Fidelity's Director of Global Macro.
Energy is leading, but this is not a single-factor rally. Industrial metals, agriculture, and precious metals are all contributing.
The chart shows a clean breakout above the 2022 highs that followed Russia's invasion of Ukraine.
This time, the catalyst mix is different - a hot war in the Middle East, supply chain disruption through the Strait of Hormuz, and persistent global demand.
For investors the signal is clear: commodities are no longer just a hedge.
They are the trade.
But can they sustain this breadth, or will the inevitable ceasefire talk pull the rug?
#commodities #inflation #macro
Broad commodity strength at 83% breadth is rare.
The last time it happened, the move had months left to run 📈
🔗 (Do not forget to subscribe to my newsletter - link in my profile @MacroMornings)


![MacroMornings's tweet photo. 🚨 [MACRO OFFICIAL STATEMENT] Nobody is talking about it
Headlines are looking in the wrong place.
The real move from the Trump administration isn’t a speech.
It’s a plumbing lever that can rewire #Treasury demand overnight: SLR reform.
But the sequence starts earlier:
- 🌍 US #equities are underperforming ex-US by ~5% YTD (widest since at least 1995). And 2025 already saw the S&P lag MSCI World ex-USA by ~12.4pp.
- 📈 Yet #earnings aren’t collapsing: Q4 EPS tracking ~+11% YoY vs ~7% expected. So why is leadership changing while fundamentals look fine?
Because the market is sniffing multiple compression + dollar regime risk (DXY vs EM equities correlation ~-0.40).
Then the physical world shows up:
- ⛏️ Zero major gold discoveries for two consecutive years (first time ever). Global money supply growth ~12.3%. Gold support to watch: ~$4,400.
And the economy is flashing a warning:
- 🚚 #Transportation job cuts at recession-like levels: 31,243 cuts in Jan 2025, driven by UPS planning up to 30,000 cuts.
The #yield curve has been positive for 14 months and is at the highest level in 4 years.
Cuts aren’t automatically bullish (2000–2002: -9.1%, -11.9%, -22.1%).
So what’s the “bazooka” nobody is pricing?
🏦 SLR reform.
- SLR forces banks to hold capital against Treasuries (because Treasuries consume balance sheet).
- If Treasuries get exempted again - like during the pandemic - estimates suggest ~$5.5T of bank #balance-sheet capacity could be freed.
That would mean: #banks become the marginal buyer of Treasuries → QE becomes less inevitable → USD can firm → gold/Bitcoin can get shaken → positioning gets punished.
Is the next regime funded by the Fed… or by bank balance sheets?
In my latest PRO piece I deep-dive in:
- 📊 The US vs ex-US rotation and why it’s not “just noise”
- 📉 Why strong EPS can still produce flat returns (2018 template)
- 🥇 Scarcity + liquidity = why gold keeps coming back
- ⚠️ Why bonds can fail as the default hedge in fiscal dominance
- 🏦 The SLR mechanism - and how it could quietly change everything
connecting:
→ relative performance breakdown
→ earnings strength vs de-rating risk
→ real-asset scarcity
→ the hidden Treasury funding lever
If you want the mechanism behind the move - not the headlines - don’t miss this.
Read my latest PRO analysis👇
https://t.co/snFjNzfNz2](https://pbs.twimg.com/media/HAo-zmobwAAiOPK.jpg)