@tonyreeswoods@PeteWargent I think they are counting gross migrations to Australia and ignoring the 200k or so leavers every year - that gives you net overseas migration.
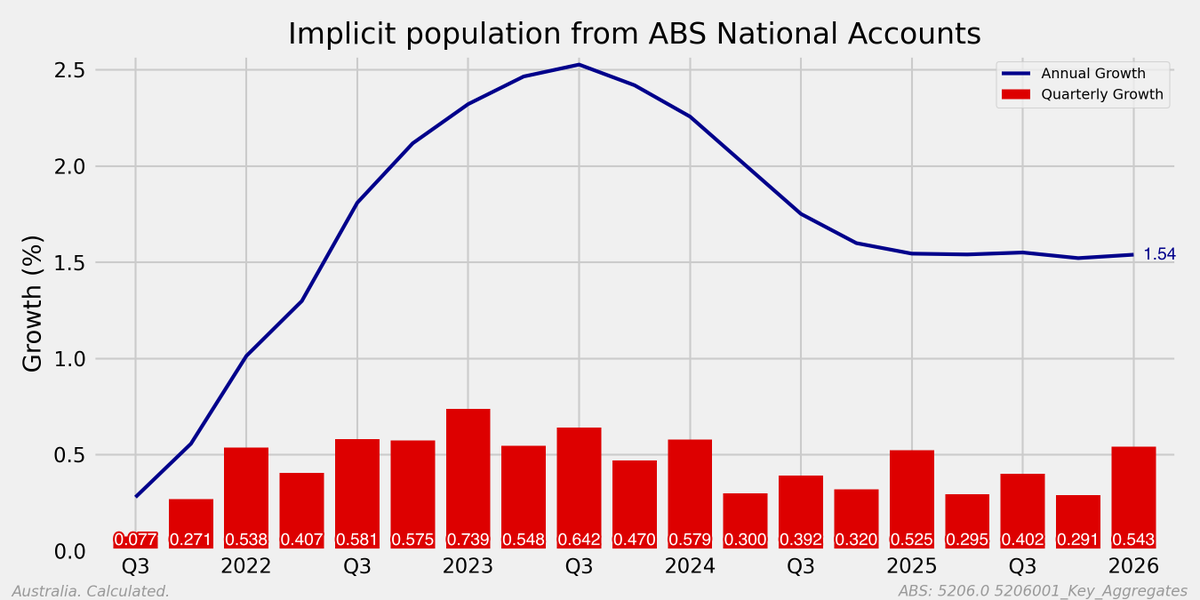
Q1 pop growth still elevated in the National Accounts. #auspol#ausbiz#ausecon
In case you are wondering 1.54% of 28,000,000 people is 431,200 people a year (which might break down something like 115k for natural increase (births-deaths) plus 316k for migration).
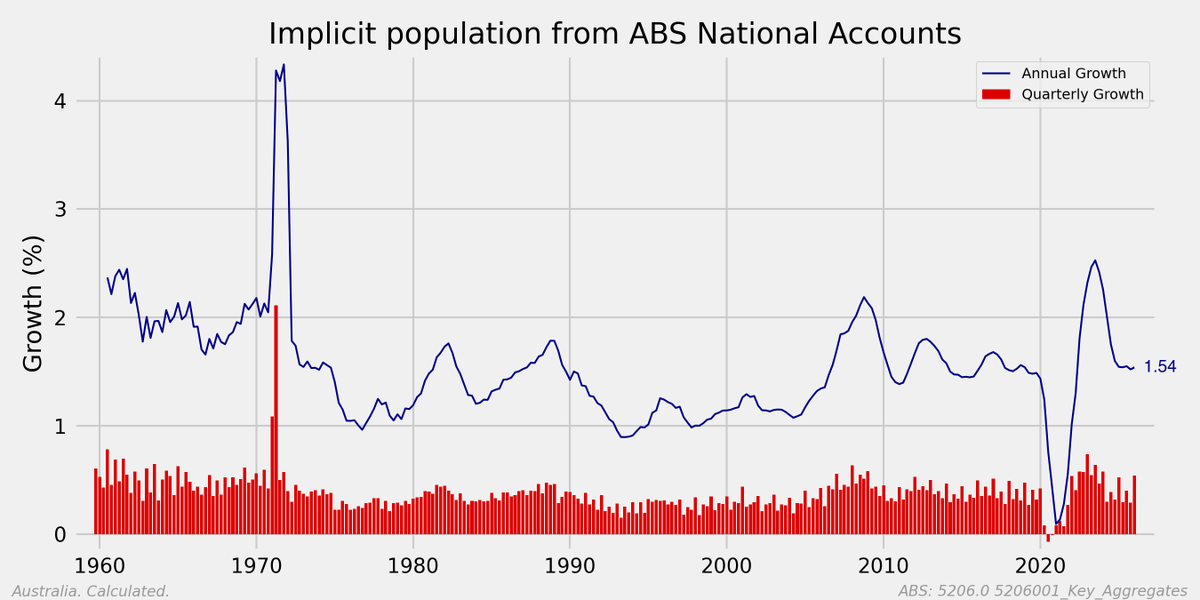
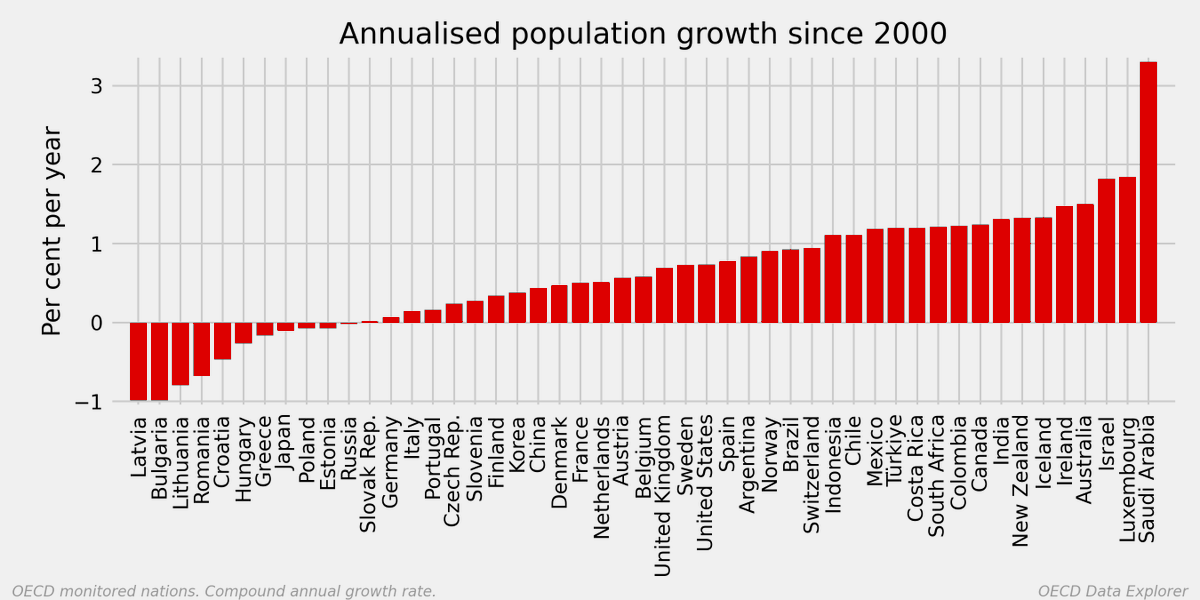
When growth stays high for decades it stops looking remarkable, but that doesn't make it normal. Australia has grown 42% since 2000 while the OECD mean is 17% and the median 15%. We're fourth behind Saudi Arabia, Luxembourg and Israel. The line feels flat because we've normalised being an outlier.
When growth stays high for decades it stops looking remarkable, but that doesn't make it normal. Australia has grown 42% since 2000 while the OECD mean is 17% and the median 15%. We're fourth behind Saudi Arabia, Luxembourg and Israel. The line feels flat because we've normalised being an outlier.
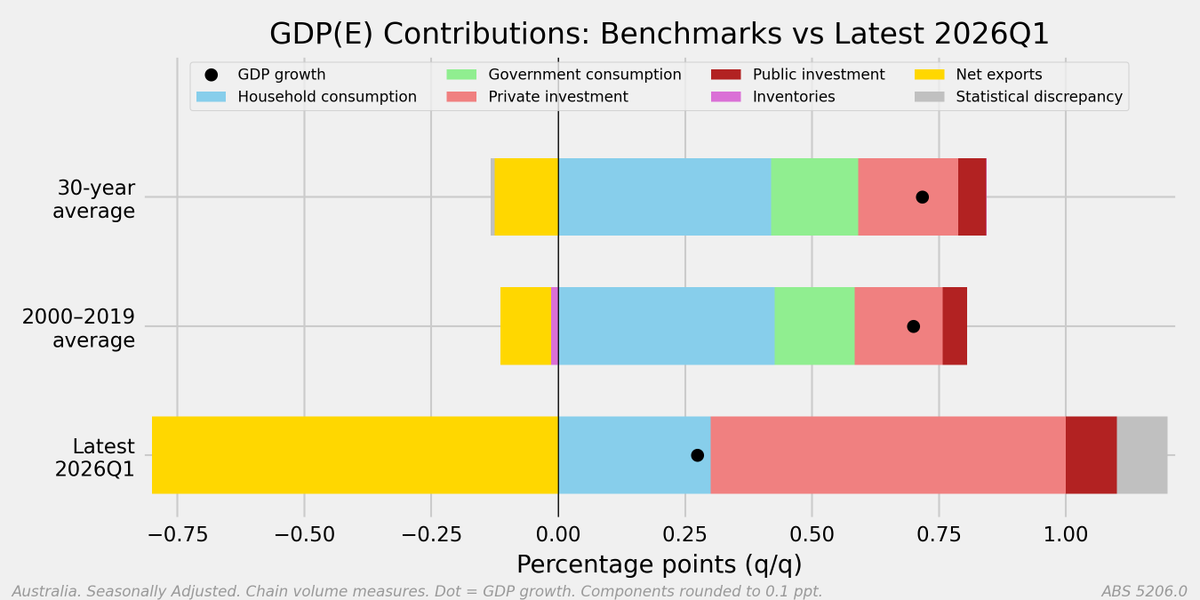
This is not the GDP report of an economy firing on all cylinders. Strip it back and the picture is an economy getting by, not getting ahead. Growth came pretty much from household consumption, but not enough that those households were better off. https://t.co/Sxtdqqx83T
#auspol #ausbiz #ausecon
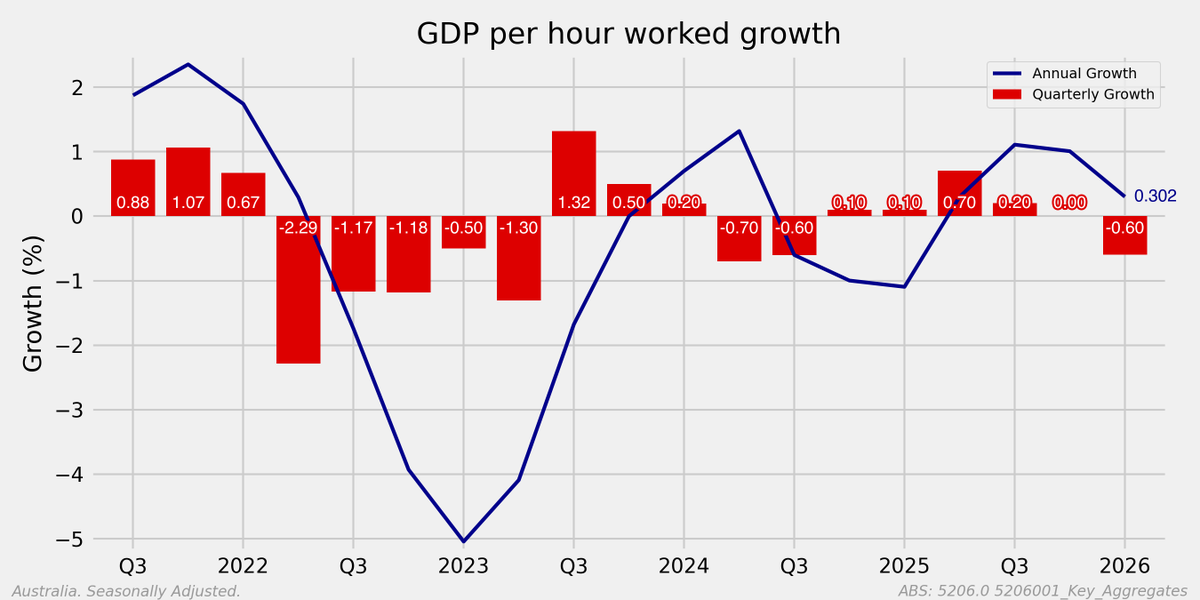
There are people who take quarterly labour productivity changes seriously. These are basically random numbers! Best not to. GDP itself not a lot better. (Seasonally adjusted shown). Longer term trends are interesting tho.
@Cloons0@samstrades They’re in the level figures, but not the growth figures - because the level of those transactions in aggregate were much the same as last quarter. There was a remarkable growth in IT related equipment into working capital that was imported.
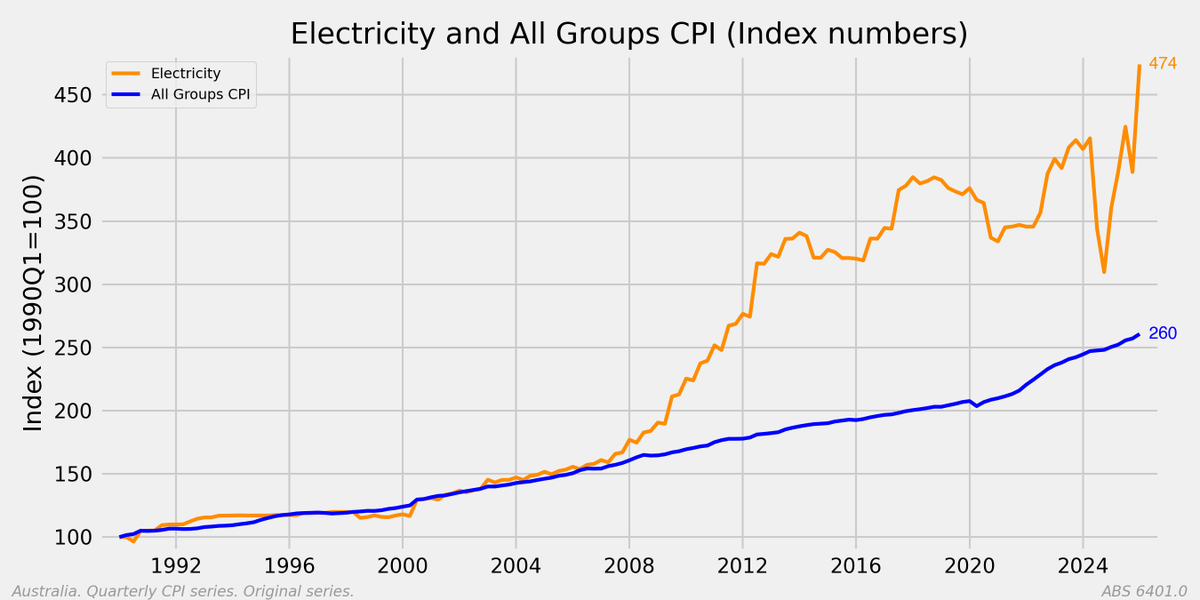
@_JohnMerchant Worst in history is a stretch, the war years had actual rationing, coupons and all. I'd like to hope prices are easing. Not convinced so far.
@CunningInsights That's a bit melodramatic. I woulkd say: disappointing, not drowning. Almost every headline indicator printed in the middle 80% historically. The economy needs to do better, not last rites.
True, and it doesn't matter which. Diesel, Silicon chips, solar panels: we import the lot and the import line cancels the spend. What's meant to show up is what we do with them afterwards: more output per hour. This quarter that went backwards. We bought the engines and got none of the horsepower.
The historical comparison, albeit not completely fair as potential (the speed limit for the economy) has fallen slowly and inexorably over recent decades, and with it productivity. Still, a lot of indicators below their historical medians. #auspol#ausbiz#ausecon
Our chief economist @peter_tulip said 'there was no reason this housing market slowdown would be larger than predecessors, which historically lasted one or two years. Rising interest rates were the “big factor” driving the slow down in house price growth.
https://t.co/ZGEwhxtwMR