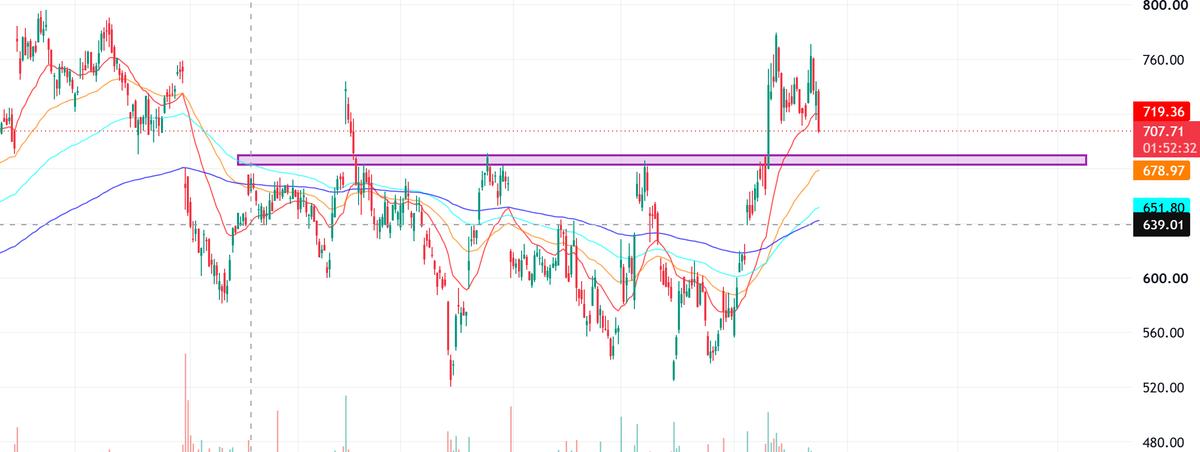
$META has slipped below the 20-day moving average near $719 on the daily chart. If it closes below $719, I’ll watch the $690–$700 range as a potential area to add.
$DELL has pulled back sharply and is testing the 100-day moving average near $452. A large gap remains around $310–$350, with the 200-day moving average nearby. Will the 100-day average hold, or could price eventually revisit the gap? Are you buying $DELL here?
$RKLB could revisit the $40 area, where the 200-day moving average sits on a weekly chart. The $50 level is key support and a major psychological mark to watch. My average is in the $60s, but I’d consider adding if it reaches $40.
$NBIS is testing the 50-day moving average near $170 on the weekly chart. A weekly close below this level could put the $140 area in play. I started a position around $175 and may add if it pulls back further.
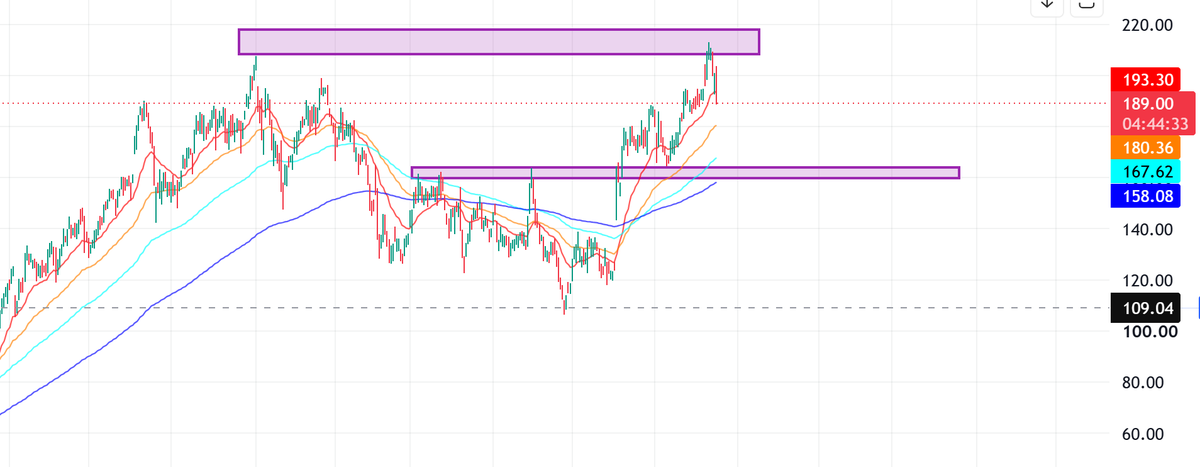
$PLTR formed a double top near $215 and has pulled back from resistance. I’m watching the $150–$160 area, near the 200-day moving average, as a potential entry zone. If price returns there and stabilizes, I’d consider starting a position.
$HIMS remains in a bullish pattern as long as it holds above $25. Resistance sits near $31, around the 200-day moving average on the daily chart. A break above $31 could put $35 and then $40 in focus. I started a small position around $30.
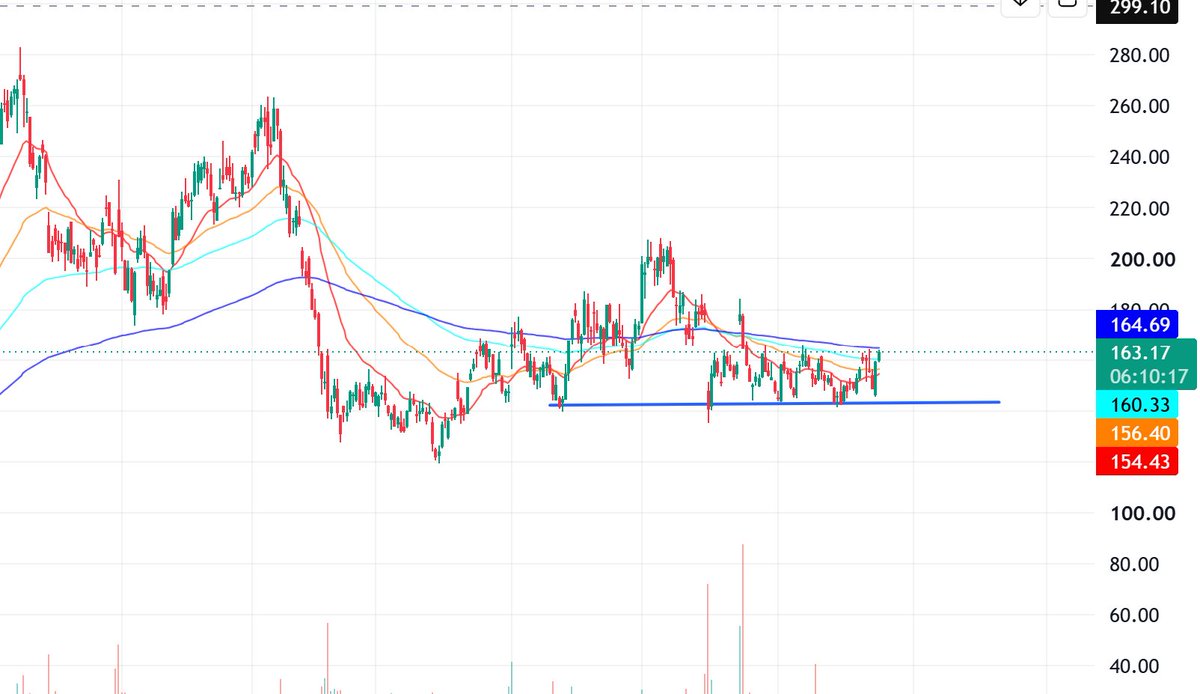
$RDDT is holding support around $140 and moving within a broad $140–$160 range. Resistance sits near $164–$165, around the 200-day moving average. A break above $165 could shift momentum toward the bulls, while a move below $140 would strengthen the bearish case.
$NOW: A daily close above $150 could open the door toward $163, with $200 as the next major target. Price is holding well above the 20-day moving average near $140. The $150 level is the key area to watch.
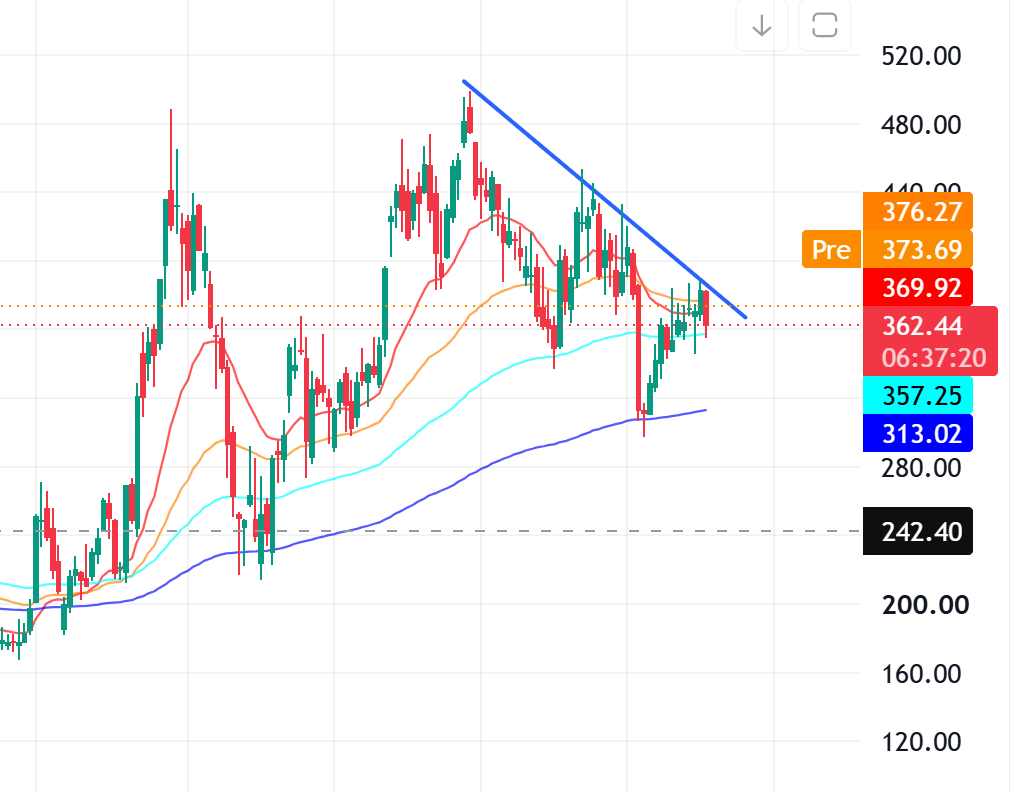
$TSLA bounced from the 200-day moving average on the weekly chart, but it’s now trading below the 50-day near $376. A weekly close above $382 would help break the falling pattern and signal a potential breakout. That level is key for bulls to reclaim.
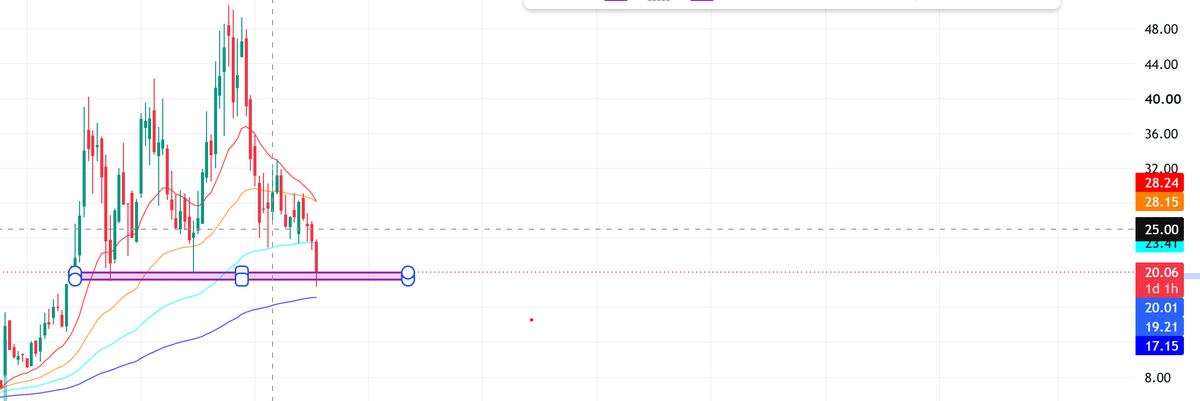
$APLD: $20 is the key level to hold. If it breaks, price could move toward ~$17, near the 200-day moving average on the weekly chart. I’ve started a small position and will be watching how it reacts around $20.
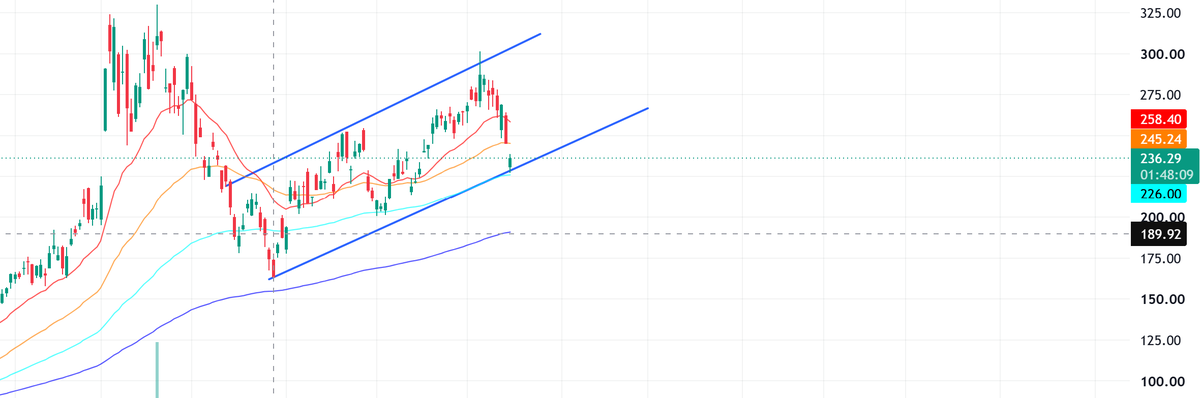
$MRVL daily chart: Price briefly tested the 100 dma near $226 and bounced, while holding its rising trendline. The $200 area is important support; a break below it could put the 200 dma near $190 in play. For now, the trendline and $226 area are key levels to watch.
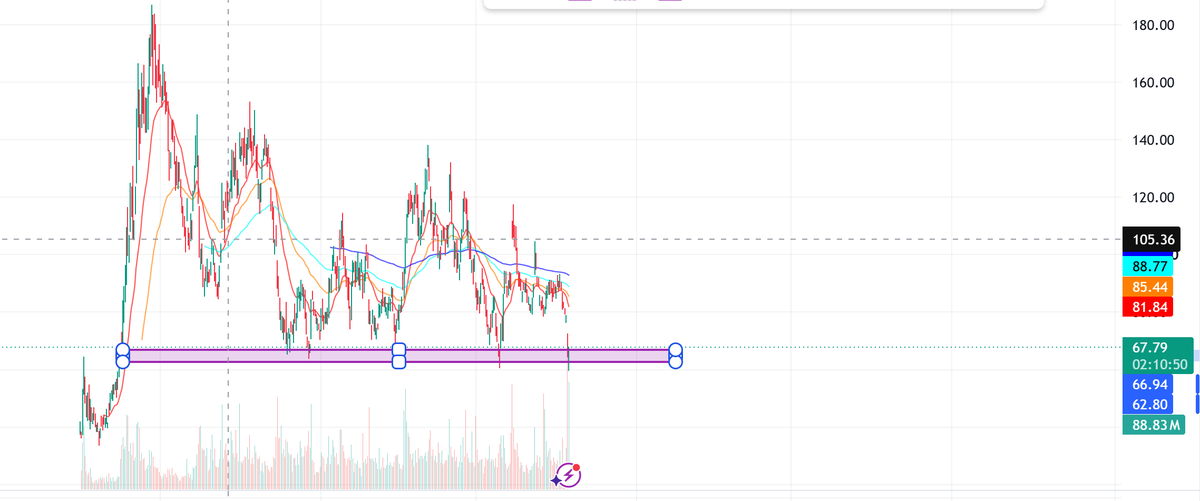
$CRWV: The $60–$65 area is the key support zone to watch. Price needs to hold this range; a breakdown below it could make the chart look nasty. Bulls need to defend this area.
$HOOD weekly chart: Price is around $102 after dipping below the 50 DMA near $97 and bouncing back. It needs to hold ~$97 on a weekly basis; a break below could bring the ~$84 area. BTC's performance may also influence the setup. For now, $97 is the key level to watch.
$NBIS: On the weekly, it needs to hold the 50-day moving average near $171; a break below could put the $140 area in play. On the daily, bulls need to reclaim the 200-day moving average near $182 to improve momentum. For now, $171 is key support and $182 is the level to reclaim.
Gary Gensler, of the SEC, said the SEC Twitter account was hacked and has not approved the listing of Bitcoin ETFs.
Meanwhile those who already traded Bitcoin.
#BitcoinETF