Waves Strategy Advisors, SEBI RA INH000001097, #Nifty on break below 23740 will resume down move to 23670 or lower, upside hurdle is at 23890, bear put spread options strategy will work for expiry
#NIFTY#Gann Yesterday Nifty closed again lower …and closed near 23779 …Nifty is slightly inching lower everyday…
Today is Nifty Weekly Expiry and premium on Put sides are more than that of Call side also synthetic Futures are in premium..Yesterday India Vix has increased more than 4% …
After Opening Premium adjustment will take place and expecting volatility..
Gift Nifty is Flat to slightly Negative….
Short only below ⬇️ yesterday low….
Mark No Trade Zone (23760-23720) on your Charts and take any trade above ⬆️ on breakout and below ⬇️ on breakdown only…
Intraday Traders——>
Long—- Only above ⬆️ 23760 till 23795-23870-23950
Short—- Only below ⬇️ 23720 till 23640-23560-23490
Trade the levels….Not News 📰 or your emotions..
Keep Qty less…Follow Stoploss Always…
Happy Trading 👍
NIFTY50 VIEW FOR 08th AUG 📊
23,848 is the key level.
If Nifty sustains above it → relief rally can start towards 23,984–24,040. 🚀
But if 23,848 fails again → downside can continue towards 23,700–23,680.
Simple plan: Level break → wait for confirmation → then trade.
#Nifty50 #Nifty #NiftyAnalysis #ElliottWave #NiftyPrediction #IndianStockMarket #Trading #TechnicalAnalysis #MarketStructure #StockMarket
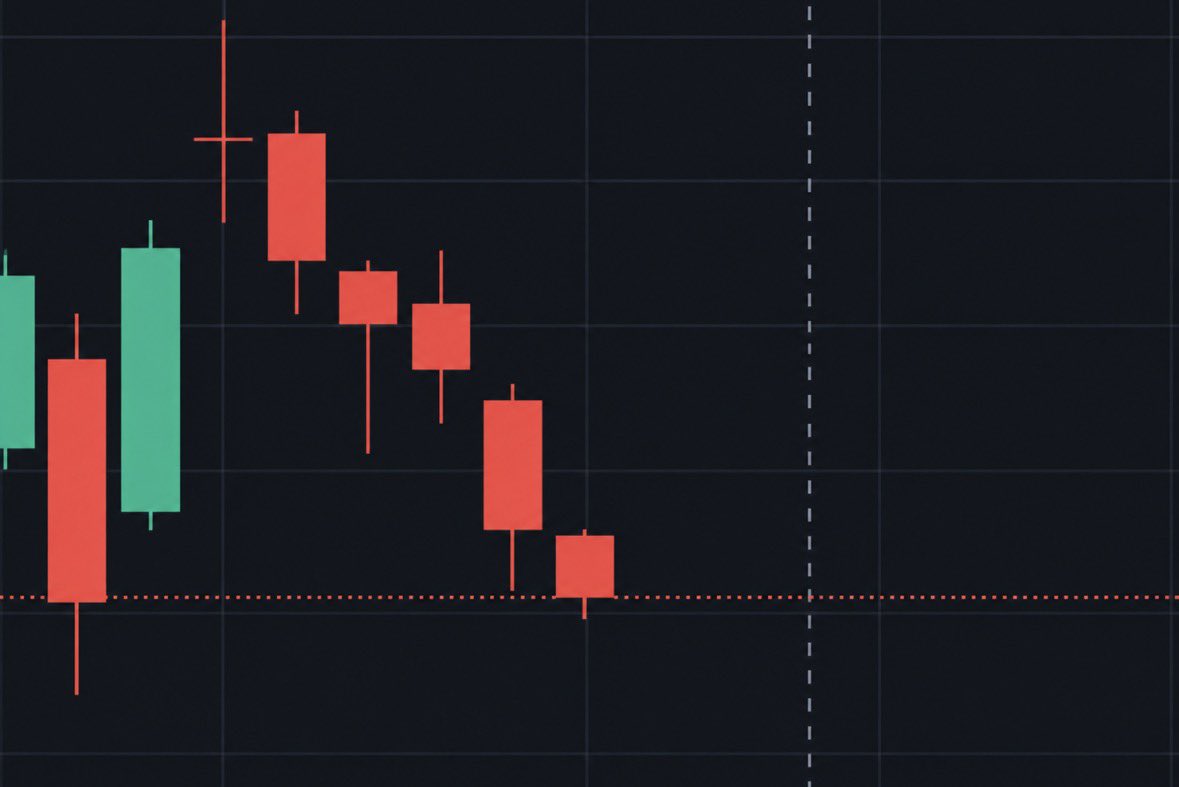
Nifty has closed in red continuously every single week for the last 6 weeks.
The great grand demise of the Indian stock market is here, ladies & gentlemen.
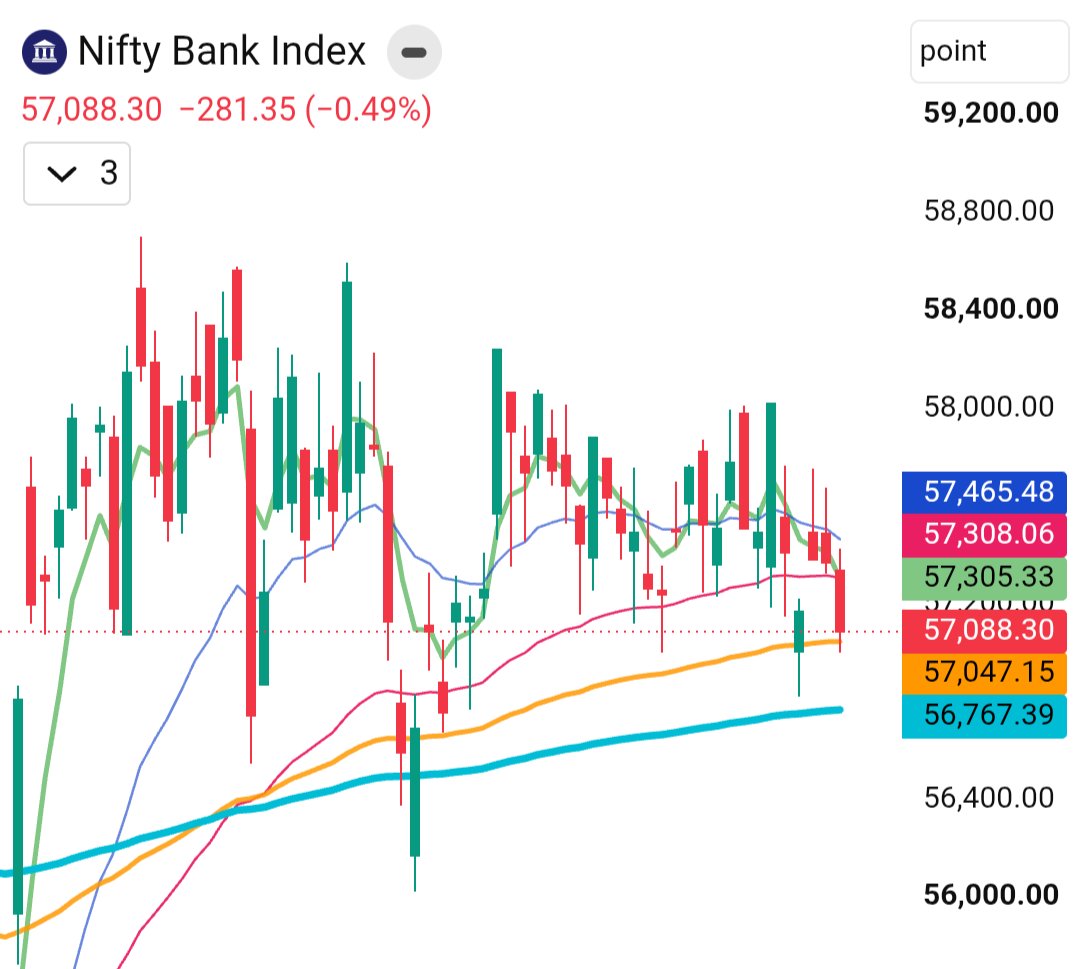
ये बैंकनिफ्टी का डेली टाइमफ्रेम चार्ट है।
15 June के बाद से इसमे कोई भी डायरेक्शनल मूव नहीं आया है और लगभग 1000-1500 पॉइंट की रेंज में मार्केट पिछले 3 महीनों से है।
चूंकि #Nifty में भी #BankNifty का 33-35% वेटेज है। इसलिए जबतक ये सपोर्ट नहीं करेगा तबतक निफ्टी भी कहीं ज्यादा मूव नहीं करने वाला और इसी तरह ऊपर नीचे करता रहेगा।
DNA Trading Setup के according जब भी प्राइस किसी चार्ट के 200 EMA के आस पास बहुत सारा टाइम गुजारे तो उसे हम गोल्डेन गेट फॉर्मेशन कहते हैं और वहाँ से किसी एक डायरेक्शन में बहुत बड़ा मूव देखने को मिलता है।
यहाँ भी बैंकनिफ्टी 1Hr टाइमफ्रेम में गोल्डेन गेट बना चुका है और एक ब्रेकआउट/ब्रेकडाउन बहुत ही जल्द expected है जिससे 3-4 हजार पॉइंट तो bare minimum कैप्चर करने को मिलेगा और उसी के according निफ्टी में भी 800-1000 पॉइंट का मूव बहुत ही जल्द expected है।
किस साइड में मिलेगा ये पहले से तो सिर्फ कोई astro बाबा ही बता सकते हैं। पर प्राइस एक्शन से DNA Setup के according, एक ही रास्ता है कि मार्केट को ऊपर या नीचे का recent स्विंग हाई/लो तोड़ने दें और जिस साइड तोड़े उस साइड एक पोजीशनल ट्रेड लेकर पूरा ट्रेंड कैप्चर करें।
आपको Telegram चैनल पर आने वाले पूरे ट्रेंड को कैप्चर करने का पूरा guidance मिलेगा।
Don't worry about that and have patience little bit more.
Waves Strategy Advisors, SEBI RA INH000001097, #Nifty fell towards 23800 exactly as discussed in the webinar. Price is still facing resistance around 24000-24030, while the 85-week #TimeCycle is approaching. What could be next? Read More: https://t.co/AfIpYbcTnN
#NIFTY#Gann
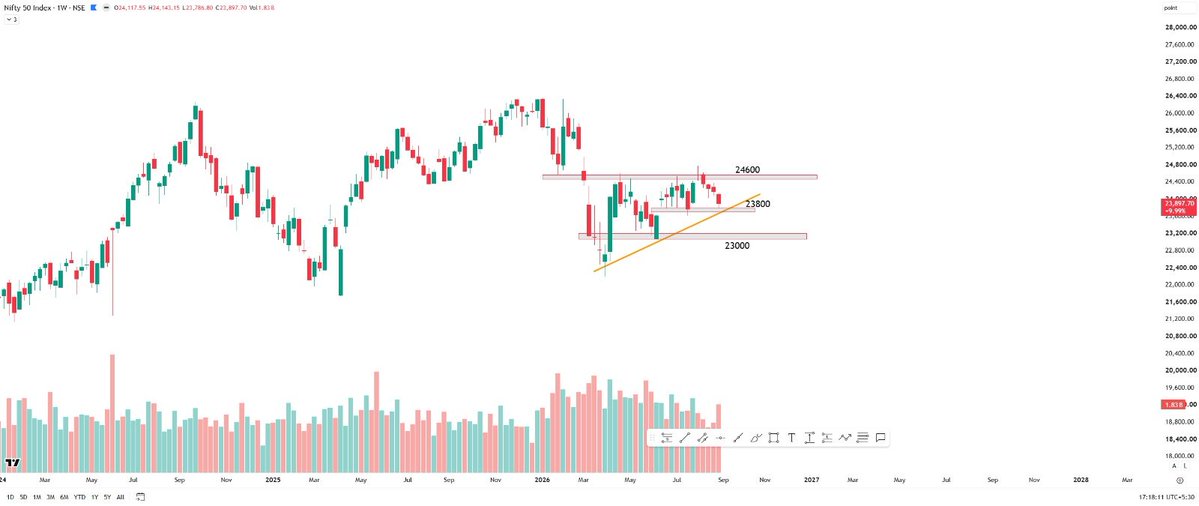
Last Week Nifty close near 23897 which we saw in weekly Analysis that Nifty has closed below the Triangular Range on weekly Basis..
Now Nifty Trend is Sell on rise but intraday It may happen that Sell on rise won’t work or may work….
Gift Nifty is Flat….
Today Traders must trade the Gann levels..given below..
Mark No Trade Zone (23910-23870) and take any trade above ⬆️ on breakout and below ⬇️ on breakdown..
Intraday Traders——->
Long —— Only Above ⬆️ 23910 till 23950-24025-24100
Short—— Only Below ⬇️ 23870 till 23795-23720-23640
Trade the levels…not news 🗞️ or your emotions…
Keep Qty less…Follow Stoploss always…
Happy Trading 👍
#Nifty
On the weekly timeframe, it is bearish for now, with 23800 as the key support zone. Need to see whether we get a reversal from here or a breakdown below this level.
On the daily timeframe, it remains bearish. For an upward move, it needs to break 24000. Below 23800, the downmove is likely to continue towards 23600.
For tomorrow: If it breaks 23800, the next support is 23600. But if it manages to trade above 23800, it is likely to remain sideways within 23850–24000. Levels are marked on the chart.
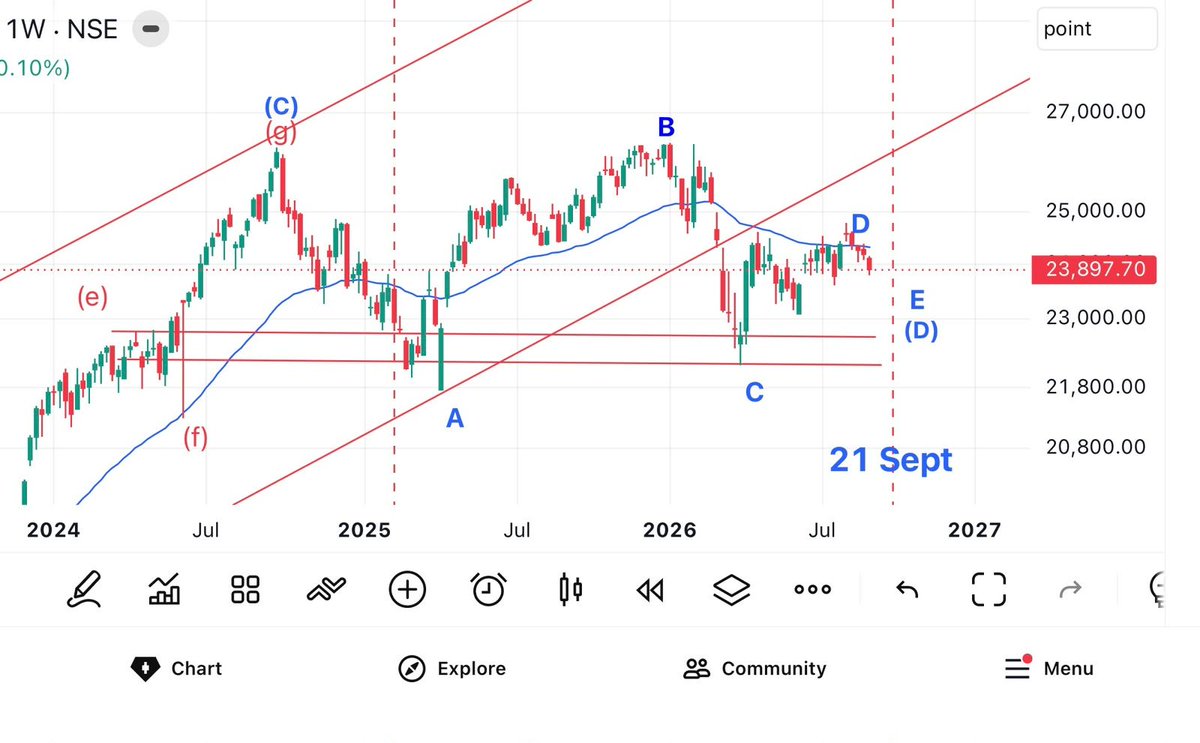
Waves Strategy Advisors, SEBI RA INH000001097, #Nifty weekly chart shows wave E ongoing which will be final push, 2 years of triangle pattern complete as 85 week cycle bottoms in 3rd week Sept, accumulation phase on!