The 21st September press conference chart showing a possible scenario of United Kingdom COVID-19 positives doubling every 7 days under a no intervention situation.
17,540 positives reported today (8 Oct), 42% lower than the 30.3k scenario daily total.
The 21st September press conference chart showing a possible scenario of United Kingdom COVID-19 positives doubling every 7 days under a no intervention situation.
6,914 positives were reported today - 54% lower than the scenario 15K daily total.
Useful chart from the BBC. Hospitalisations have gone up in France and Spain, but certainly in Spain it seems to be under control.
These are the two examples that get referenced most, many countries are not seeing significant spikes.
We need caution, but panic will help nobody.
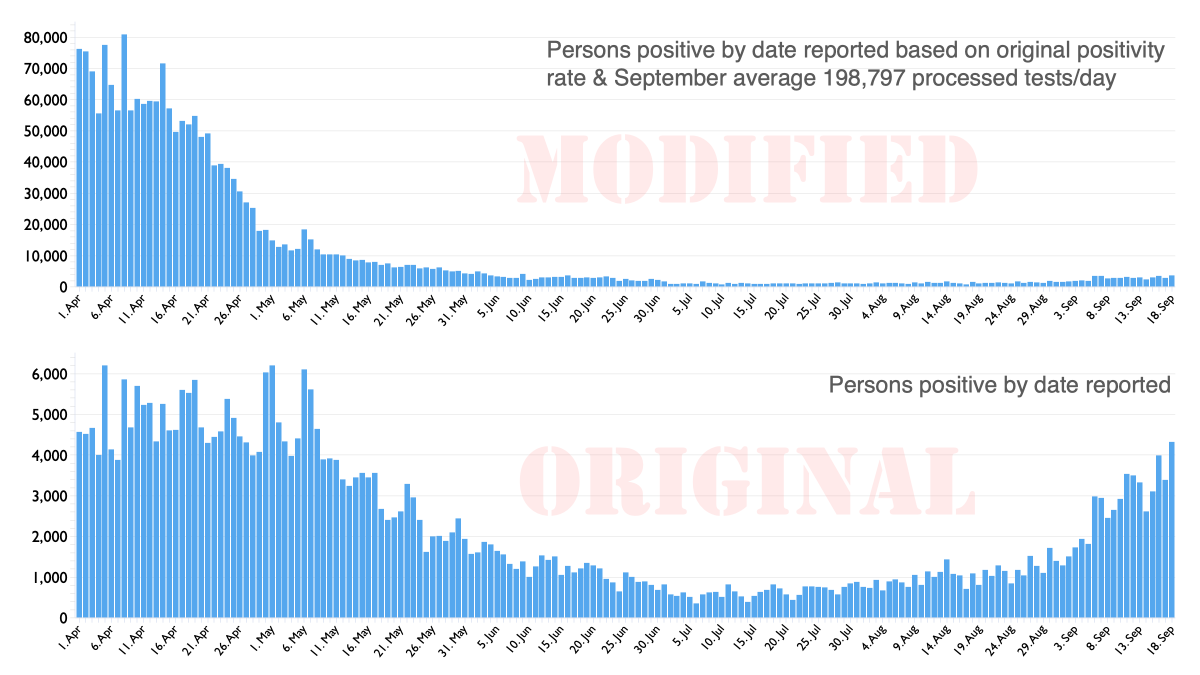
A PURELY EXPERIMENTAL chart based on COVID-19 daily reported positive persons in the UK.
The top chart demonstrates what the positive trend may have looked like if we were testing at the September average rate since April.
The bottom chart plots the original positive results.
I supported the first lockdown at the time, it was an unknown virus then.
It's not now. Would it be just 'two weeks'? I doubt it. The consequences would be enormous, we're still reeling from the last one.
Please stop the threats & just focus on getting testing working today.
I'm walking in the Welsh hills (terrible signal) so sorry I'm late to this.
A big jump in cases, but imp to look at the whole pic. 2 deaths reported & most recent data shows no of people in hospital is steady.
Still, it's not good news. We need to be careful & all do our bit.
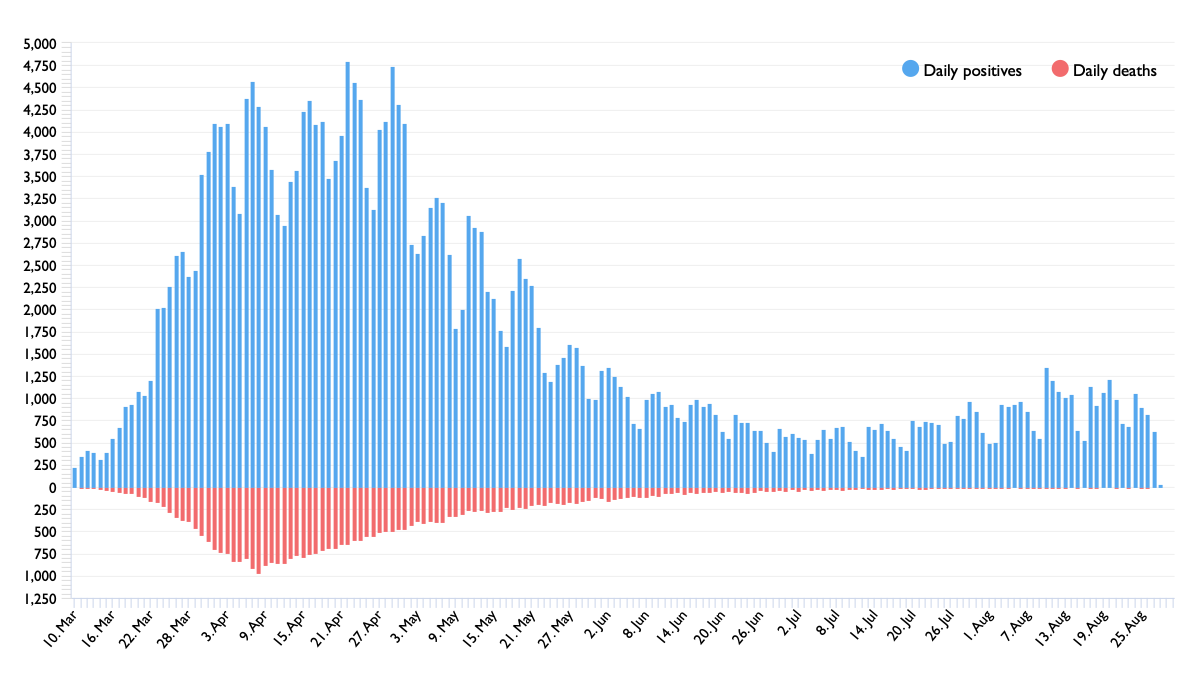
You've probably seen this style of chart floating around the last few days - I've put one together for England COVID-19 cases (people positive) by specimen date and deaths (28-day measure) by date of death.
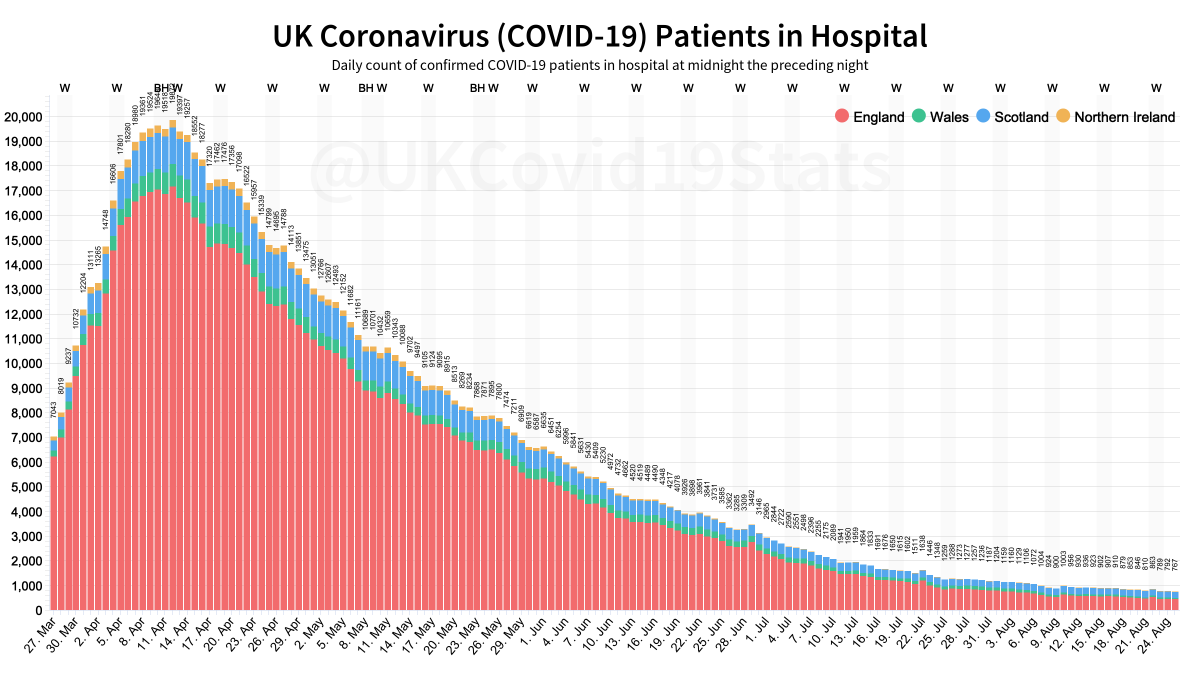
As of the 25th August, 767 patients were in hospital in the United Kingdom with coronavirus (COVID-19).
Since the peak on the 12th April, the number of patients has decreased 96% from 19,872 to 767.
Over the last 2 weeks the number of patients has decreased 20% from 956 to 767.
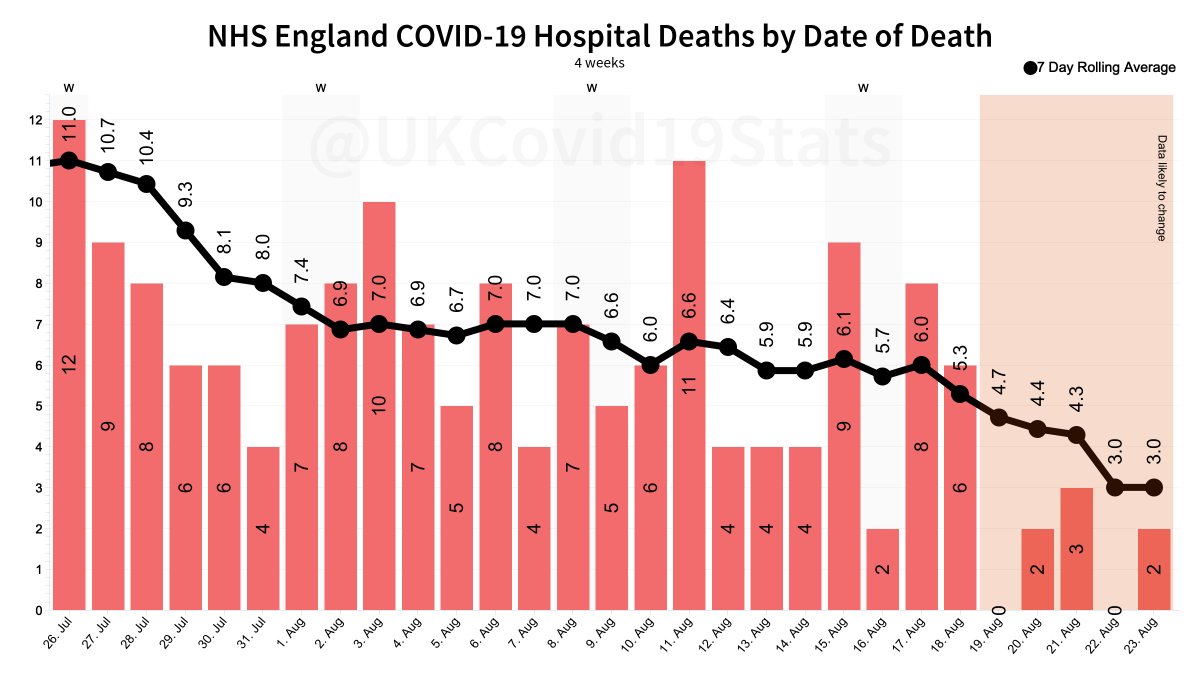
NHS England reported 3 more COVID-19 related hospital deaths today.
2 = 23rd August (1 day ago)
1 = 3rd April (143 days ago)
The 7-day rolling average now sits at 5.3 as of 18th August with a total of 29,500 deaths in English hospitals.
August 19 continues to have ZERO deaths.
It's Saturday night so going to be a little informal!
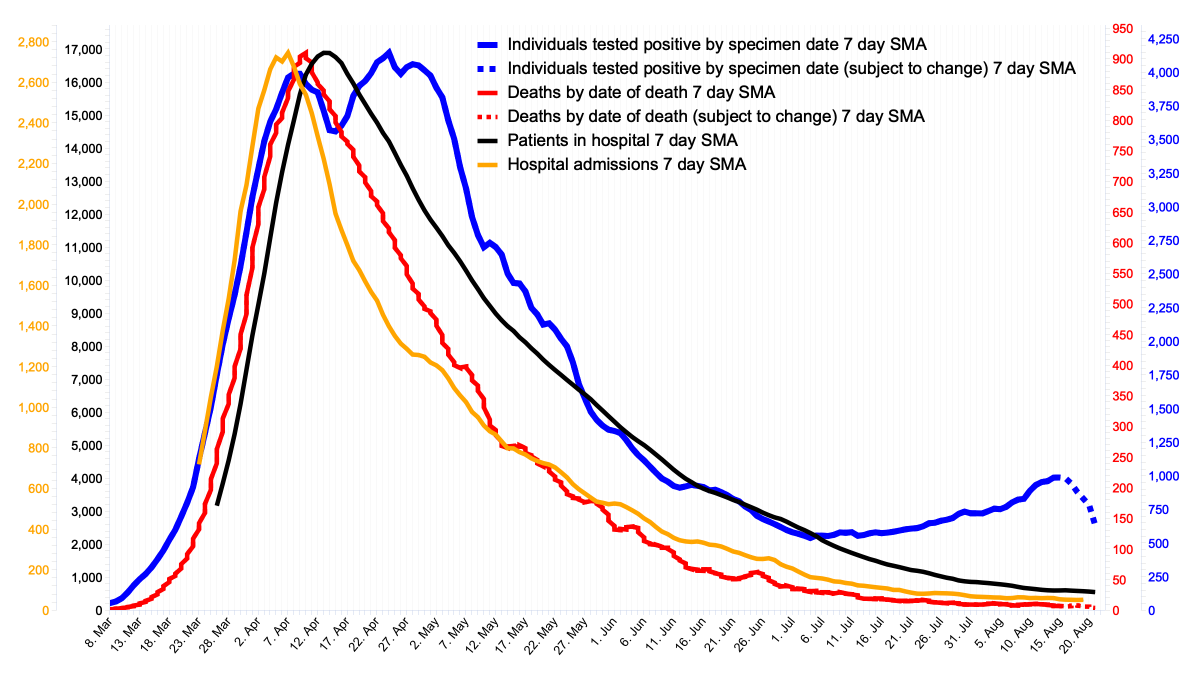
This is some of the most important COVID-19 data for England, all combined in a single chart. (other nations to follow).
7-day moving averages of positive people, deaths, hospital patients and admissions.
It tells a story!
1033 new UK reported cases today, down significantly on last Friday's 1441. The 7 day average has dropped for six days in a row in England.
2 UK fatalities were reported.
480 Coronavirus patients in English hospitals, it's good to see that below 500 for the 1st time in months.
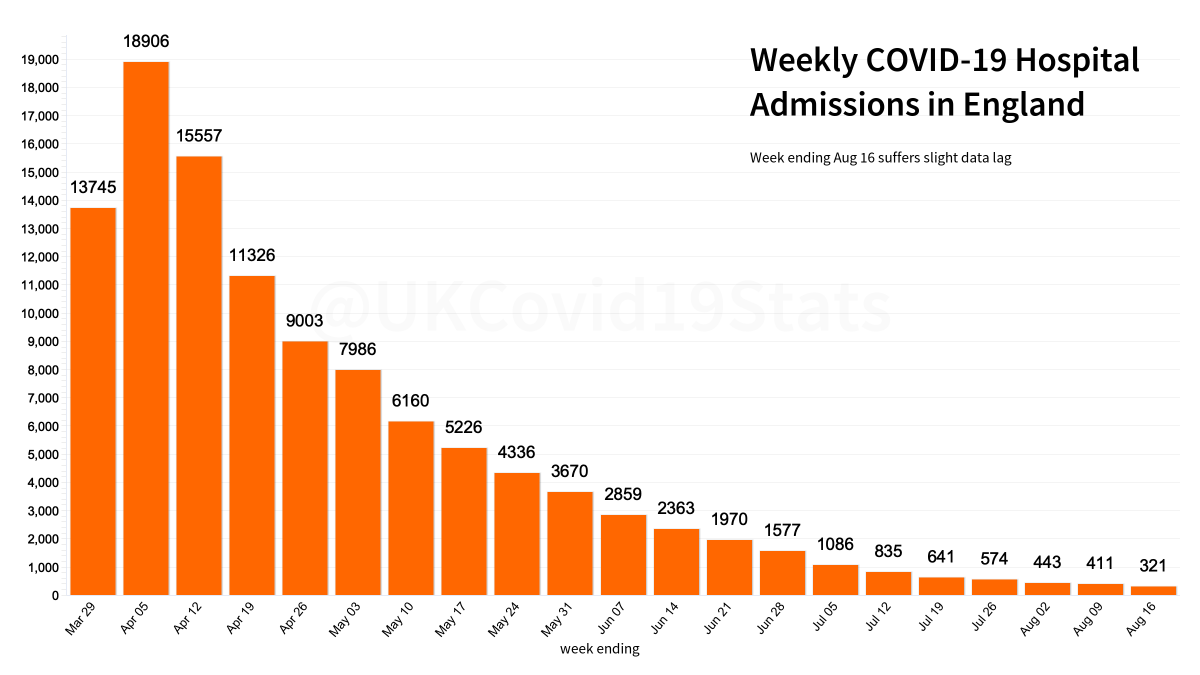
COVID-19 hospital admissions in England have decreased week on week since w/e Apr 5 (peak) where 18,906 people were admitted.
8 weeks after the peak 3,670 people were admitted - an 81% decrease.
Week ending Aug 9, 411 people were admitted - a 28% decrease over 2 weeks previous.
Cases down again on last week, the 7 day rolling average falls slightly again.
It certainly isn't spiralling out of control after a few higher days last week.
545 Coronavirus patients in hospital in England, it was 1211 a month ago. Encouraging to see that continuing to fall.
Interesting to note you didn't tweet yesterday when the figure was significantly lower than Sunday.
Also not mentioning the 7 day average has fallen again as today's total was less than last Tuesday.
We know the numbers could be better, but please could we have some balance.
Encouraging to see the 7 day rolling average fall for the second day in a row after some rises with 713 cases reported today compared to 816 last Monday.
3 reported fatalities today.
Lots of factors in play. It's important to look at the whole picture, not just the cases.
Comparing the UK daily reported COVID-19 deaths over the last 8 weeks.
4,702 deaths were reported (yellow bars).
If the 28-day cut off method was in place for England 8 weeks ago, 1,823 deaths would have been reported (red bars).
4,702 - 1,823 = 2,879 less reported.
8 more COVID-19 related hospital deaths were reported by NHS England today spread over 5 dates.
The 7-day rolling average now sits at 6.6 as of 8th August with a total of 29,452 deaths in English hospitals.
Public Health England reported a total of 2,324 COVID-19 deaths for England in July.
The new 28-day cut-off counting method reduced that by 68% (-1,581) giving a total death count of 743 in July.
102 deaths were knocked off the 114 daily reported figure for 31st July alone.
United Kingdom Pillar 1 (PHE labs, NHS hospitals and health and care workers) COVID-19 infections by date reported.
Pillar 1 infections have fallen 85% since the 1st June and 17% over the last 2 weeks.
A very good statistic to track the most serious case trend.
ONS have updated their all settings date-of-death series up to 31 July. Deaths in England now below 20 per day.
Latest dates subject to further updates but 18 deaths on 28 July. The discredited (& officially suspended) PHE series reports 48 for that date, 2.7 times higher!