I was asked to clarify this.
The concept of "opposite direction" causes a lot of confusion in the MT Community.
I asked @MoneyTaura about this topic some time ago in her Discord.
These are the most important takeaways:
Image 1: There is no specific opposite direction trade method for hidden liquidity (not poles).
It all comes down to market structure, PA and RM => You wait for BOS and enter at PB. Then, you ride the continuation in the direction of the initial move.
Image 2: Market context can override the BOS rule. (+PA is not the only thing to consider look at Orderflow, VSA, Majors, News sentiment, etc.)
Image 3: Pay attention to the strength and magnitude of swings (=>strong/weak breakouts).
She explained these points in more detail on her Discord. If you want to read them, just join her Discord—it's free and one of the best places to find answers to your questions.
+This is my interpretation of her words.
First step in MT's 3 step process:
1] close above key SH or below key SL.
The important question is what TF close to use for which TF Trades?
MT mostly uses the 4H, 8H, 12H closes. More in detail🔻
• Thread
👌 Spoon-feeding
A clear TP at liquidity levels adds confluence to a level.
Imagine price always having a predetermined, calculated path, moving between liquidity levels.
What path is most probable if there is no liquidity above, but there is below your level?
It becomes more probable that price will ignore your level, using it later as fuel for continuation after a pullback.
That’s also why, for example, bullish levels with no liquidity below them are more powerful—because price wouldn’t have any liquidity from which it could reverse after a pullback into the newly converted bearish BB.
MT emphasized this in one of his recent posts too, with reference to "ping-pong" between levels.
https://t.co/z6PZpVAg2b
🧵How Market Makers Engineer Liquidity
MM is the only volume actor that can move price sustainably.
Retail can’t move price — they can only react to it.
MM wants to fill his orders at key levels.
His objective is to fill his positions without moving price, therefore he uses news releases to manipulate retail into counteracting his actions.
Furthermore, he uses accumulation and distribution patterns to bait retail into his Key Levels — forcing them to sell him their positions while simultaneously manipulating them to position themselves perfectly for liquidation on an aggressive reversal.
However, a critical question arises:
If only MM can move price between key levels, who moves the price after he’s fully positioned — while retail is merely reacting euphorically to a narrative he created?
My thesis is this: MM keeps the majority of his position for HTF key levels, similar how @Moneytaur_ changes his sizing based on the timeframe, imitating real MM behavior.
Price action is fractal.
MM repeats the same accumulation/distribution process on smaller ranges to manufacture the liquidity necessary for the next leg up.
Let’s say MM has filled most of his core position at the low.
The reversal begins, fueled by retail liquidations and FOMO buying. But as momentum slows down, the next wave must be engineered.
So what does MM do?
He repeats the process on a smaller range:
• He creates distribution patterns on lower timeframes
• Offloads small tranches into euphoric hands
• Traps new late longs
• Induces shorts with fake breakdowns
• Then lets price form a higher low — drawing in retail once again into a carefully constructed accumulation trap
Retail believes they’re shorting early on weakness, but in truth, they’re just taking the fall — again — for the next leg up.
MM recycles volume through fractal distribution and accumulation ranges to stimulate demand and supply — while maintaining control.
Of course, most retail liquidations occur at the extremes of the range,
because there the highest panic/euphoria can be induced.
However in between those extremes, retail liquidations are strategically used like a ladder to get to the other extreme.
MM never needs retail to move price.
He only needs them to react — at each step of the liquidity ladder.
By recycling parts of his position through partial accumulations and distributions, he manufactures just enough micro-liquidity to climb toward the next HTF key level — all while keeping his core position intact and letting retail die for the cause.
Intersection of TL with KL helps identify where retail volume provides liquidity for market makers to fill their orders.
+Potential KLS (SFP while taking Liquidity)
MT: "I might use a TL here and there just to understand when retail volume is coming in.
This will help understand what's whales next move."
+MT: "I don't enter/exit @ TLs."
MT's Head and Shoulders
• Neckline doesn't have to be horizontal
• Shoulders don't have to be on the same height.
Examples:
1.
https://t.co/ip9PyIcLOX
2.
https://t.co/3kcSij3Brx
MT: The true powerful H&S or Three Drives is on the Daily.
Those are where MMs intentions are clear, or what I call their "footprints".
It's where your success rate when identifying It can be extremely high.
Patterns + Trendlines + Moving Averages
MT about H&S + Demand
https://t.co/Lso6FPdQUr
Most powerful H&S and 3 Drive on Daily(MM footprints)
https://t.co/Tm9FHA8TND
Use of Trendlines to understand when retail volume is coming
https://t.co/u3aGTX3USH
HTF Trendline + Neg Fib => Short Level
https://t.co/E2okh4XgcB
Use of Moving Averages Golden Cross to trap retail
https://t.co/pNFO801f90
Opposite Poles
MT OP definition: Wicks behind FVG
https://t.co/ZxVlmTcNMI
Refine Opposite poles (behind FVGs on other TFs)
https://t.co/QSG6MVwLNs
Fib confluence with Poles
https://t.co/ABHLN2Gsa1
Fib doesn't need to align perfectly, just closely
https://t.co/hYpHBjmOVe
Entry condition for Poles: Reentry if only wicks above pole. Closure above = invalidation
https://t.co/maRF6sbarV
BB + OP => more optimal higher R:R possible
https://t.co/6S01pshB7m
Theory on OPs
https://t.co/Jnw95zXBWn
Checklist before Entry:
• Candle closes:
If refined Levels are converted entry invalidated until reclaim
Closes can also be used as entry trigger on the next candle
>12H TF = at least 4H close (the higher the better
2-12H = at least 1/2H close
<2H = Same TF close
Less confluence from Majors
=>chose more conservative closes
Higher R:R possible by using more refined lower Timeframe Levels for candle closes
More optimal:
• Level taken not just small wick
• no MTF bodies beyong Level (2H+)
LTF S&D
• Refine LTF PA within/close to Key Level into OB/BB
> SOS/SOW if PA surpasses those
• Most optimal: Converting into a BB > Shield for stop
• Less optimal melting level = closes within level but then closes beyond it
You don't want to enter if there is strong S&D in your way
> Wait until PA surpasses it and ideally converts it.
Additional SOS:
• LTF/MTF BOS coupled with CVD divergence
• VSA: If one can observe relatively high volume but candle spreads become thinner over time
• Reclaim of SFP, KLS
• Wyckoff/TCT
• Majors confluence
*Converting Levels = FVG goes through them
Examples of candle closes:
⚠️ Liquidity Cheatsheet ⚠️
The Algos that run the markets are programmed
"To go after liquidity levels, to respect fibs, to close imbalances, (...)" -@Moneytaur_
I will explain how to find those liquidity levels:
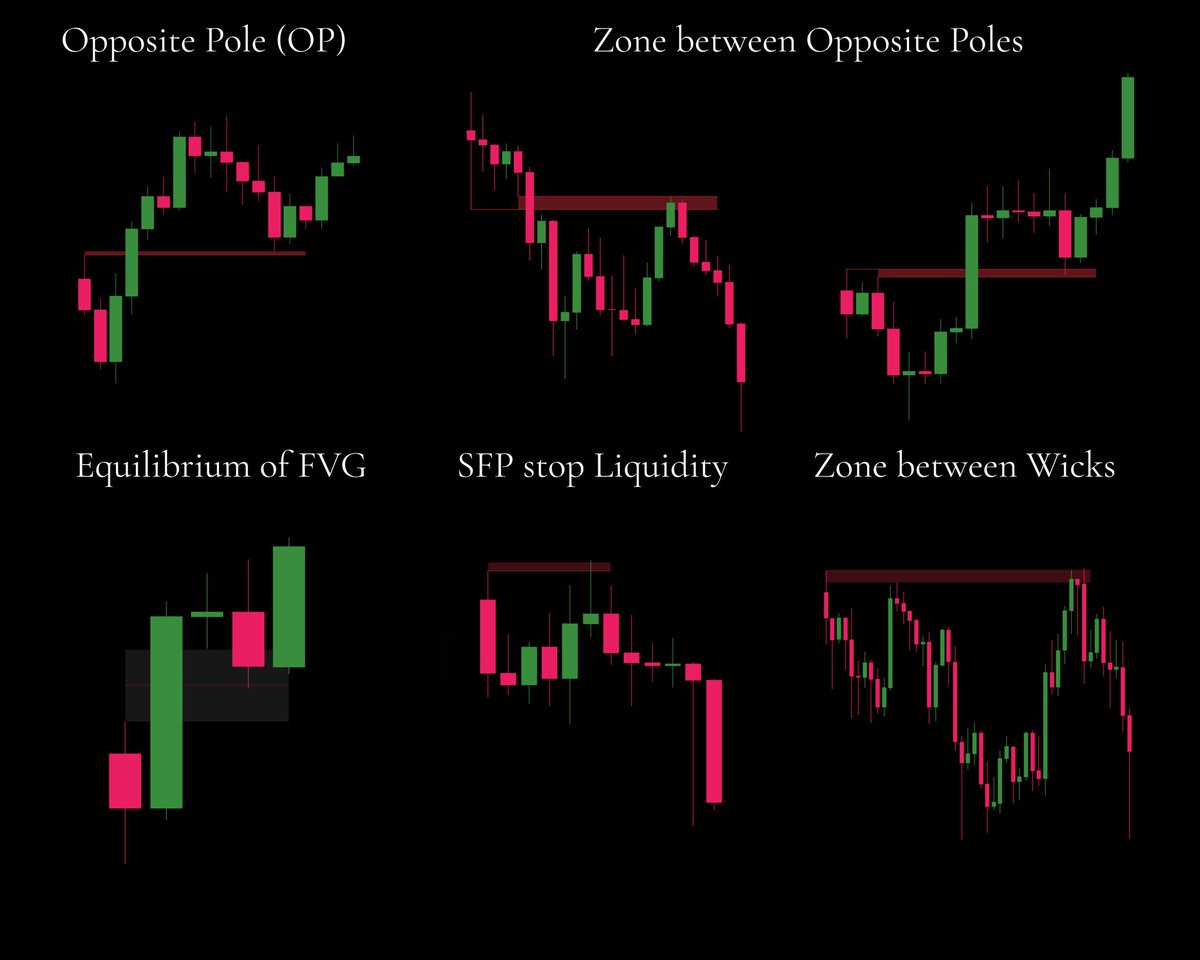
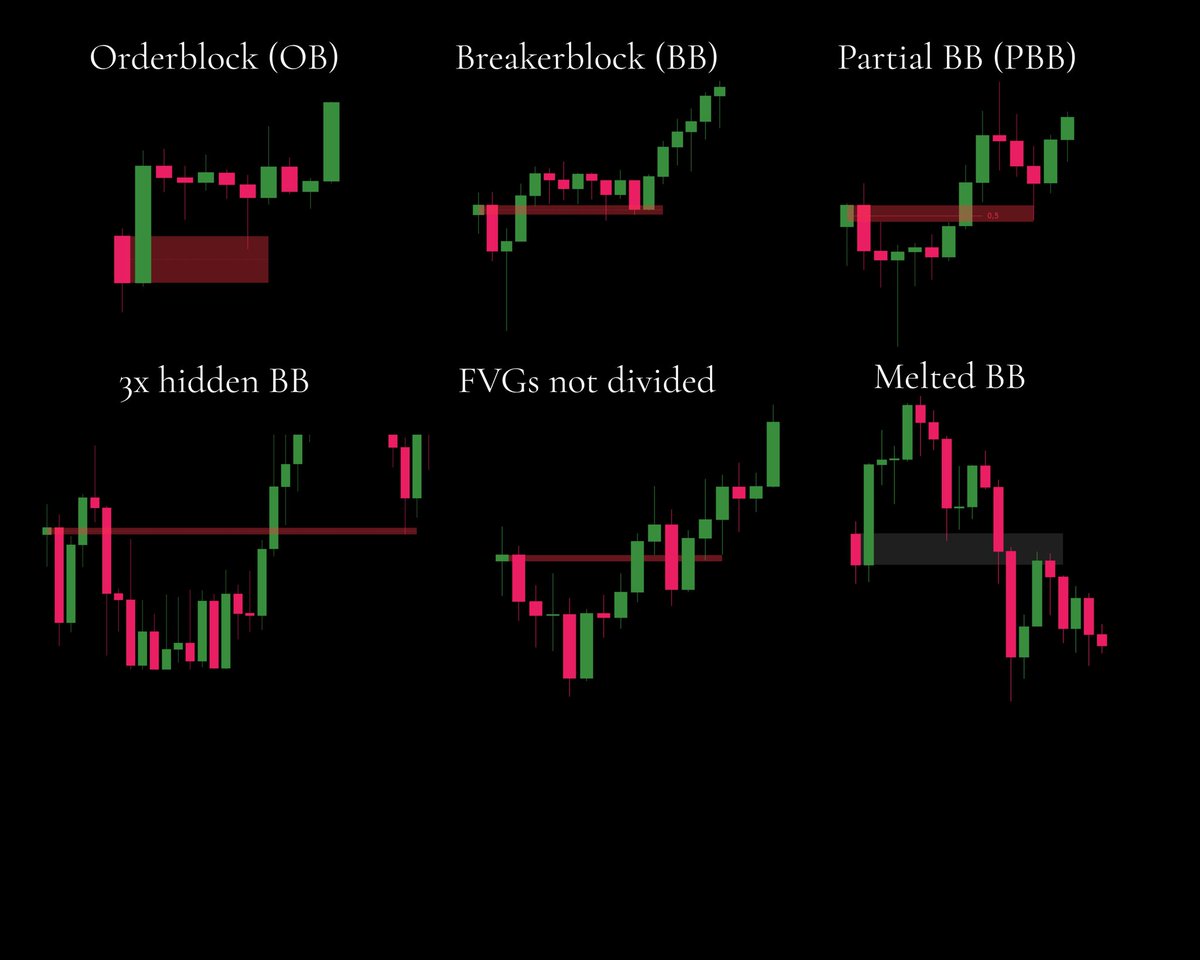
🔹Image 1: Liquidity Blocks
Order Block (OB) = Candle + Larger Candle (opposite color)
Breaker Block (BB) = Order Block fully hidden behind a FVG (see Image 2 for FVG explanation).
The more hidden it is (behind more FVGs), the more powerful it becomes. And the higher the timeframe, the more powerful it is.
Partial BB: If the Order Block was wicked into, narrow it down to the unwicked portion. It’s only valid if the equilibrium (EQ=0,5 fib) of the OB wasn’t taken.
Undivided FVGs are weaker, but they can still be used.
Melted Breaker Blocks (BBs) are the weakest.
A Breaker is stronger when price moves quickly through it. For example, a 1D Breaker Block (BB) with a 12H wick inside isn’t fully untouched as it would appear on the 1D timeframe.
But if the Breaker Block is ignored even on lower time frames through FVGs, it becomes much stronger because its liquidity remains fully intact.
That’s also why refinement works, it reveals the untouched areas on lower timeframes.
For better entries, you want to see a Break of Structure and a retracement into those liquidity levels.
🔹Image 2: Wicks
FVG = Grey Zone
3-candle pattern: One large candle between two candles with wicks. The zone between those wicks is the Fair Value Gap.
The EQ of an FVG can act as an important confluence since algorithms often use it.
Opposite Poles are wicks located behind an FVG. You can use a single pole and the zone above/below it, or the area between two poles.
Wicks (Swing High/Low):
The majority of stops are usually located above swing highs or below swing lows. These stops provide liquidity before market makers reverse price. (SFP=Swing Failure Pattern)
The zone between wicks marks an area where price action could execute an SFP on the nearby swing high or low.
An SFP of the major swing high is possible, though price might front-run the most obvious wick.
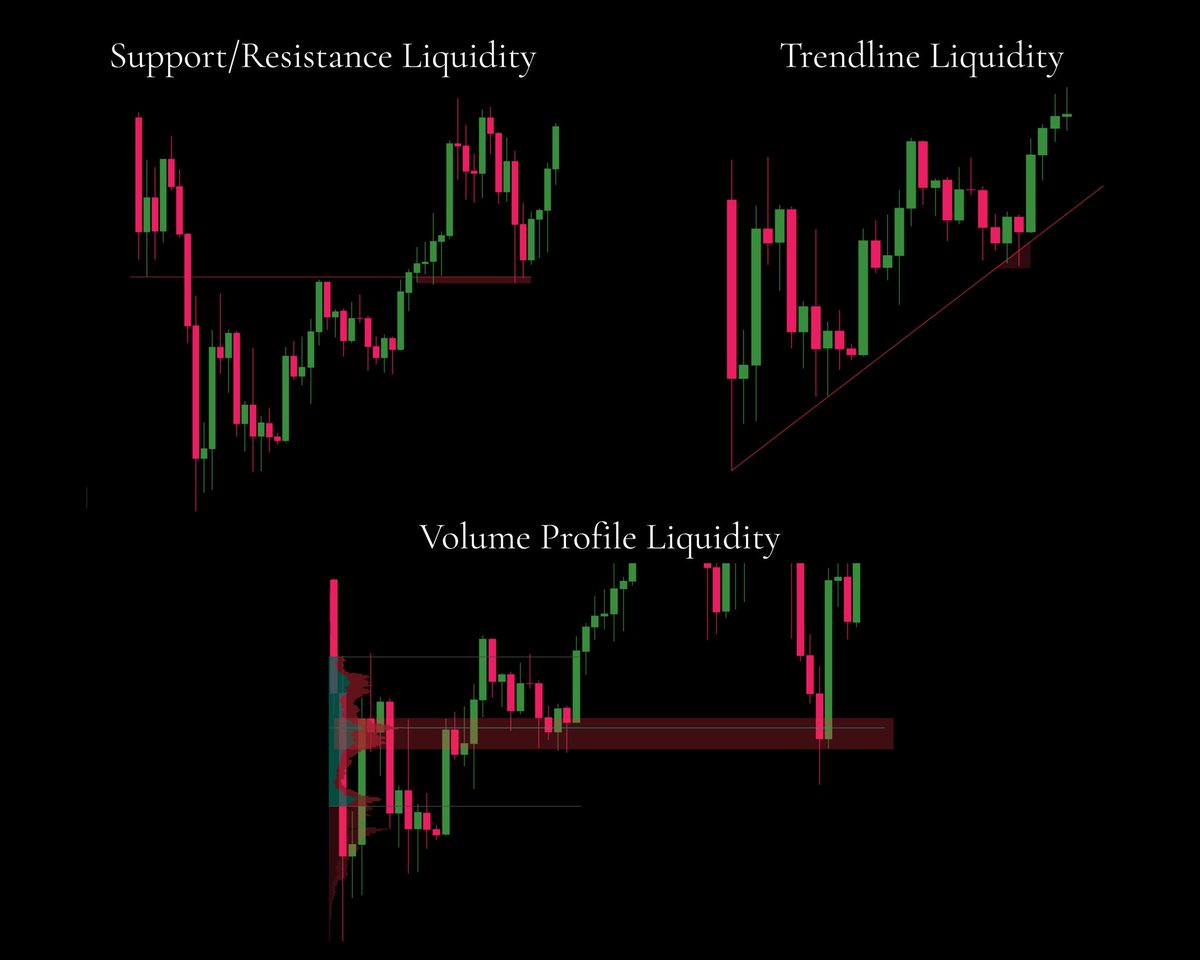
🔹Image 3: S&R, TL, VP
Support and Resistance offer liquidity because retail traders commonly use these levels.
Market makers identify liquidity or stop clusters below support and above resistance, similar to how they view trendlines.
The Volume Profile shows where most positions were opened. These areas often contain breakeven stops or intentions to exit at breakeven, making them zones that provide counterparty Liquidity for MMs.
Value Area Highs (VAH) and Value Area Lows (VAL) are also important levels.
If price fails to trade outside these levels, aka as a failed auction, it often returns back into the value area.
"Once you see it, you can’t unsee it." -MT