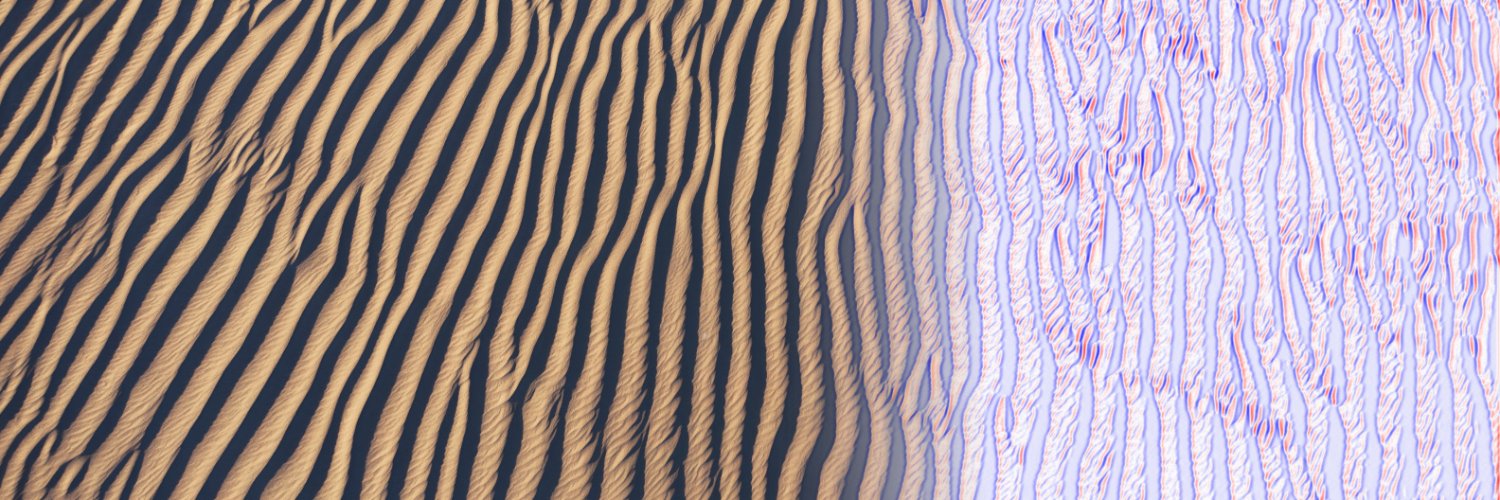
@__mharrison__ For example, see the lightness profiles for the matplotlib built in colormaps here. The perceptually uniform cmaps (viridis, plasma, etc) are straight lines. Any good colormap/gradient used to represent data should look similar
https://t.co/hIVR1l8OtH
@__mharrison__ Ok this is awesome. One thing I would love to see is an automatically generated lightness profile for the gradient.
Colormaps used to represent data should have monotonic increasing lightness (L*) with each step proportional to the steps in the data space
@__mharrison__ I agree that with static plots and publications, matplotlib is the way to go,
But do you like plotly better than hvplot, holoviews, and bokeh? I haven’t used plotly that much, but been really happy with hvplot.
@grajohnt@snnkcz Interesting! I guess having the blocks means people don’t have to stretch their brains as much? They look super cool and I’d have liked to play with them. Still would actually
What happened is scientists discovered chlorofluorocarbons were bad for the ozone, countries believed them, the Montreal Protocol was signed, and CFC use fell by 99.7%, leading to the stabilization of the ozone layer, perhaps the greatest example of global cooperation in history.
@__mharrison__ Also check out the probscale library if you would like to scale your probplit axes by the normal distribution (probit scale). I’ve written up some examples:
https://t.co/N0aWMsY3Pw
@CMastication We are trying to do this now. And had the “citizen” discussion last week. It sounds like the superhero saying: “stand aside citizen!”
Any advice you have learned about making these user group communities successful?
@BobLovesData I just finished up some online training covering some of these tools. fwiw, the last thing I’m left with is the impression that I know what I’m doing. More of a long list of things I should learn more about
@CMastication@BobLovesData Maybe he is. Our capstone project is due today so there are probably quite a bit of posts going around highlighting the work. I think there’s a link to one from Reddit in the comments
This is the course:
https://t.co/Aoxk02CzBy
@CMastication@BobLovesData I’m glad to hear this. I just finished my project for the same course that I’m pretty sure is being subtweeted here. And this is the approach I took for the project. (Jupyter to airflow, a tiny bit of dbt sprinkled in and a simple streamlit app)