@Osint613@WeThePeopleOf76 Yeah his dementia and other medical problems are catching up and he will soon be gone from the land of the living, we’ll see i guess
since my last post on IG is shadow banned again, I am doubling down AGAIN & giving away 0.11 BTC to 3ppl that like, share and comment something related
- no bots allowed
- dont post wallets
in 24h someone from my team will DM you on IG and ask for your wallet
good luck! 🍀
GOD BLESS EVERY INNOCENT SOUL THAT IS SUFFERING DUE TO ISRAELS WAR MONGERING
MAY GOD PUNISH EVERY SINGLE PERPETRATOR OF HARM AGAINST HUMANITY
ON EVERY SIDE
Life is fucking electric bro. Don’t fall for the doomer shit. That’s for losers and normies scared of their own shadows. Walk around like God sent you and smile at everyone you see. Spread light and abundance. Build things and take chances. This is the best time in history!
@kian_sasan Is this real ? Gotta have a chance for those 0.11 BTC then.
Also im intrigued to know more about the entropy network, launch is soon right ?
BREAKING: since my last post on the gram is BANNED I’m giving away 0.11 BTC to 11 lucky winner that share the post, like it and comment something related 🚨😘😁
rules:
1) no spam
2) no wallets posted
3) no bots or fake accounts
resolution in 24h, private dm on insta
I think many discretionary traders misunderstand the true value of confluence in trading. The common mistake is believing that success comes from stacking multiple indicators or even from selecting the highest-quality signals available. However, neither the quantity nor the individual quality of indicators is what actually matters most.
The key principle that people often overlook is correlation between their signals. When you add an indicator that essentially measures the same market dynamic as another one you’re already using, you’re not actually strengthening your analysis. Instead, you’re creating an illusion of confirmation that can be dangerously misleading.
By ensuring your confluence comes from genuinely independent sources, you avoid the trap of unjustified conviction based on what is essentially the same information repeated multiple times.
@0xChicoiner Since many people asked for various timeframes: here’s a plot of mean and median returns vs days forward per category. You can see how extreme fear consistently underperforms even 6 months out.
I was concerned the mean and median alone might give a false impression, so I added interquartile bands to show the range containing the middle 50% of the data for each day forward. Both charts use the same y-axis scale to maintain comparability.
I hope this helps better assess the variance at play and gives a more complete picture.
One last note on the Fear & Greed Index
When people encounter the Fear and Greed Index in their feeds, they typically operate under a straightforward assumption:
• low index values predict positive future returns
• high index values predict negative future returns
In other words, the index functions as a mean reversion indicator: when markets are overbought (extreme greed) or oversold (extreme fear), people expect that prices will revert toward the mean from these extremes.
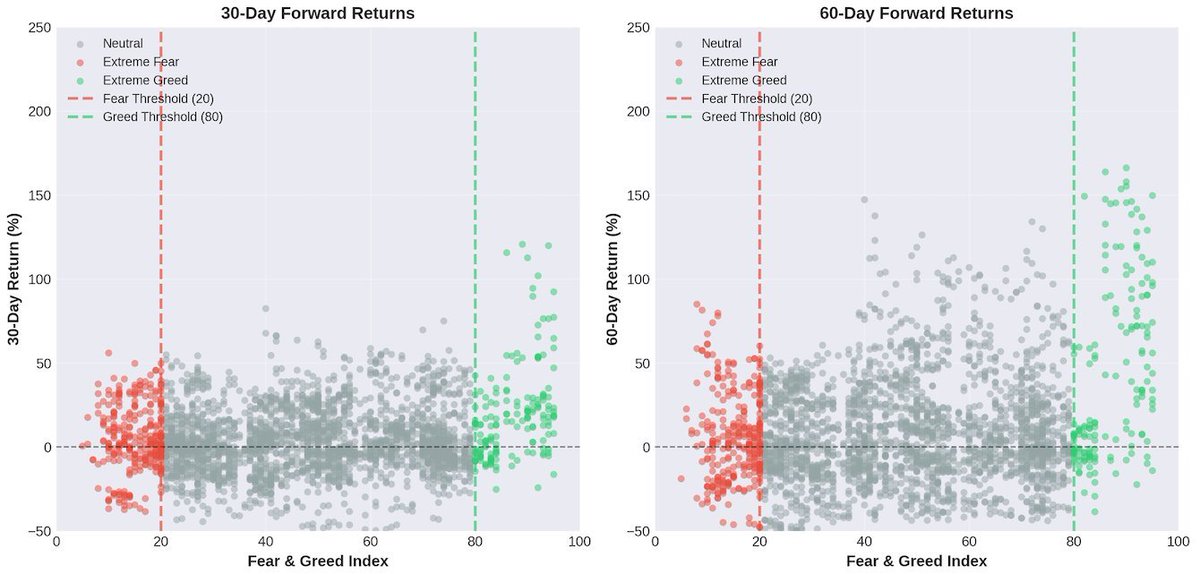
This is a hypothesis we can test. We can examine actual returns following extreme index readings. An easy and fast way to do this is to plot returns against index values and visually inspect the relationship. Under our mean reversion hypothesis, we would expect to see:
• low index values: data points clustering top left
• high index values: data points clustering bottom right
The results reveal a lot of noise, but also a pattern, particularly in extreme greed territory: the indicator frequently fails during trending markets. When you trade based on overbought or oversold signals, you're essentially positioning against the prevailing trend. In practical terms, this means buying too early in downtrends and selling too early in uptrends.
Instead of confirming our hypothesis, we not only find considerable noise but sometimes even the opposite of what we would expect to happen. Obviously, you can discuss how this approach could be slightly tweaked to improve performance. Criticism is welcome, as always.
My point is: this is a metric influencers love to hype, but as the chart shows, it’s mostly just noise :)
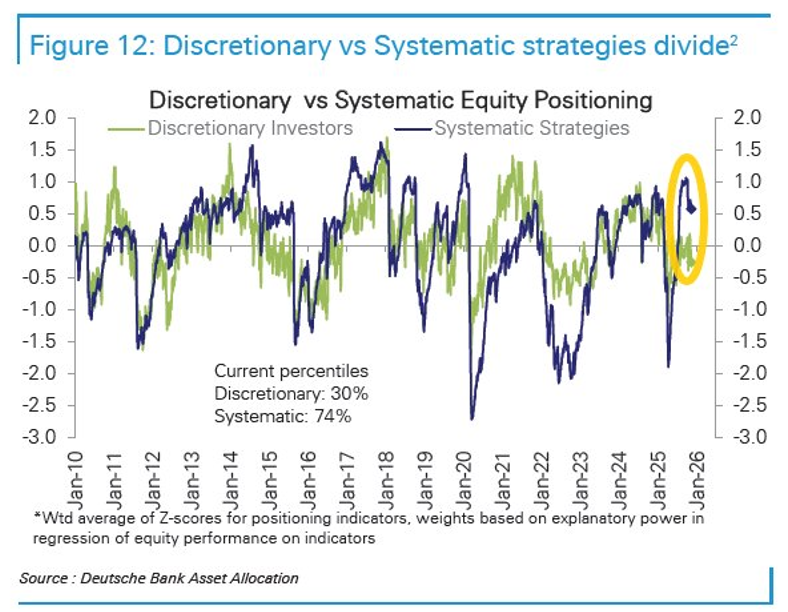
This is one of weirdest markets (US stocks) from a positioning point-of-view.
And it's been weird for months.
But this week could be a big week.
What we've seen is a massive divergence between systematic (quantitative strategies that buy and sell stocks based on certain rules) and discretionary (humans making decisions).
Due to the bizarre structure of the market in recent months (low volatility with shallow pullbacks), systematic strategies have loaded up on huge amounts of stocks and powered the market forward, becoming particularly overweight.
But the current dynamics heading into this week have systematic strategies primed and "locked and loaded" to start selling in a big way.
Both vol control funds and CTA strategies (the two largest systematic cohorts) are currently "on the edge" and close to a big deleveraging if the market continues dropping/volatility rises.
These types of situations can drive a "cascade" where systematic selling triggers further systematic selling.
Meanwhile, discretionary investors haven't really added any net exposure for months.
They are still very cautious and have been for months.
According to Deutsche Bank, discretionary investors "are positioned for negative earnings growth, even as it looks to be on track to pick up to the low double digits, in line with our forecast of 16.4%".
Most professional money managers have had a terrible 2025 so far, with only 22% of active funds beating the market this year so far - the worst annual performance for decades.
Hedge funds in particular have also been shorting stocks in big size in recent weeks.
If we see some kind of "trigger" (like perceived "bad" Nvidia earnings on Wednesday) and the market starts sliding lower and realized volatility rises, systematic strategies will likely start selling big.
So, the current situation looks quite precarious and can deteriorate quickly.
I think in this context - Nvidia earnings are even more important than normal.
The big question is whether discretionary investors are actually going to start stepping in or not.
I feel like they might do so in the event of a normal 5-10% S&P 500 correction (we haven't seen one since April).
I've been expecting some kind of "performance chasing scramble" into year-end - but it doesn't appear to be happening, yet.
This situation also has big implications for bitcoin/crypto - they're already weak and its extremely unlikely they will bounce if the stock market is rolling over.