Hi X
I’m Mohammad Shahebaz, a Power BI Developer & Data Analyst with 5+ yrs of experience.
I’ll be sharing:
• Dashboard breakdowns
• DAX & Power Query tips
• Data modeling lessons
If you work with data, let’s connect.
Which Power BI topic should I cover first?
#PowerBI
₹1,203 crore. 249 contracts. 17 Nov.
IPL teams have 8 days to decide who stays. So who earned their 2026 contract?
81 players played under 3 games, ~₹123 Cr in contracts. Best value: Sooryavanshi, ₹1.1 Cr, Orange Cap.
Who should your team release? 👇
#IPL2027#powerbi
18 years. 28,527 international runs. 86 hundreds.
Happy Birthday, Virat Kohli 🎂
I built a Power BI dashboard covering every run of his career: Tests, ODIs, T20Is and IPL, 2008 to 2026.
What stood out:
• 15,109 ODI runs at 58.79, only the 2nd batter ever past 15,000
• Chase master: averages ~66 chasing in ODIs vs ~51 batting first
• 30 Test, 55 ODI and 1 T20I hundred (that 122* vs Afghanistan)
• 9,300+ IPL runs, all for RCB
• Best year: 2016, 3,568 runs incl. 973 in one IPL season
Data: ESPNcricinfo + Cricsheet ball-by-ball.
Your all-time favourite Kohli innings? 👇
#HappyBirthdayViratKohli #ViratKohli #PowerBI
Just delivered my 2nd healthcare project as a freelancer 🎯
A 27-page Breast Cancer Patient Monitor in Power BI, built for a healthcare market research consultancy in the Middle East. One place to track breast cancer patients across hospitals and countries, quarter by quarter.
What's inside:
📊 Patient share: month-on-month trends, market share, new vs dropped patients
🔄 Treatment journey: source of business, switching and time on treatment
🏆 Brand scorecards and quarter-on-quarter comparison
🧬 Clinical profile: stage at diagnosis vs current stage, TNM analysis and biomarker testing
🎯 Clinical indications: eligible patients by HER2 / HR segment and line of therapy
🔥 Market insights: brand heatmap, patient flow and opportunity view
✅ A data quality page that flags issues before they reach a chart
What I learned:
• Clean data matters more than visuals. Fixing text dates, spelling variants and duplicate categories took as long as the pages
• Writing clinical rules in DAX means agreeing every definition with the domain team first
• A "More filters" panel keeps 20+ slicers usable without cluttering every page
Stack: Power BI | Power Query | DAX | Data Modelling
Client data is confidential, so no screenshots.
Need a Power BI dashboard for healthcare or pharma data? DMs are open 🤝
#PowerBI #HealthcareAnalytics #DataAnalytics
Wrapped up a freelance project I really enjoyed 🎯
An oncology patient-tracking dashboard in Power BI for a healthcare market research consultancy in the Middle East. It tracks patients and treatments across hospitals in the GCC, quarter by quarter.
The challenge:
Multi-sheet Excel files with text dates, spelling and spacing variants, missing IDs, and serial numbers that restart every quarter, so every refresh needed careful cleaning.
What I built:
• Power Query ETL that cleans the raw files, with a parameterised data source so the client can switch files in a few clicks
• A star-schema model with DAX for patient share, new vs dropped patients, like-for-like quarter comparison, retention and rule-based clinical indicators
• 25 report pages, including a brand heatmap, a patient-flow waterfall and a hospital opportunity view
• Field parameters, a slide-out filter panel and dynamic titles
• An automated data quality page that flags bad records
What I learned:
Accuracy builds trust faster than design. I checked every number against an independent reference before delivery, so the feedback rounds were about improving the story, not fixing the figures.
Client name and data are confidential, so no screenshots.
Planning a Power BI dashboard? Excel, SQL, SAP, SharePoint or any other source, DMs are open 🤝
#PowerBI #HealthcareAnalytics #DataAnalytics
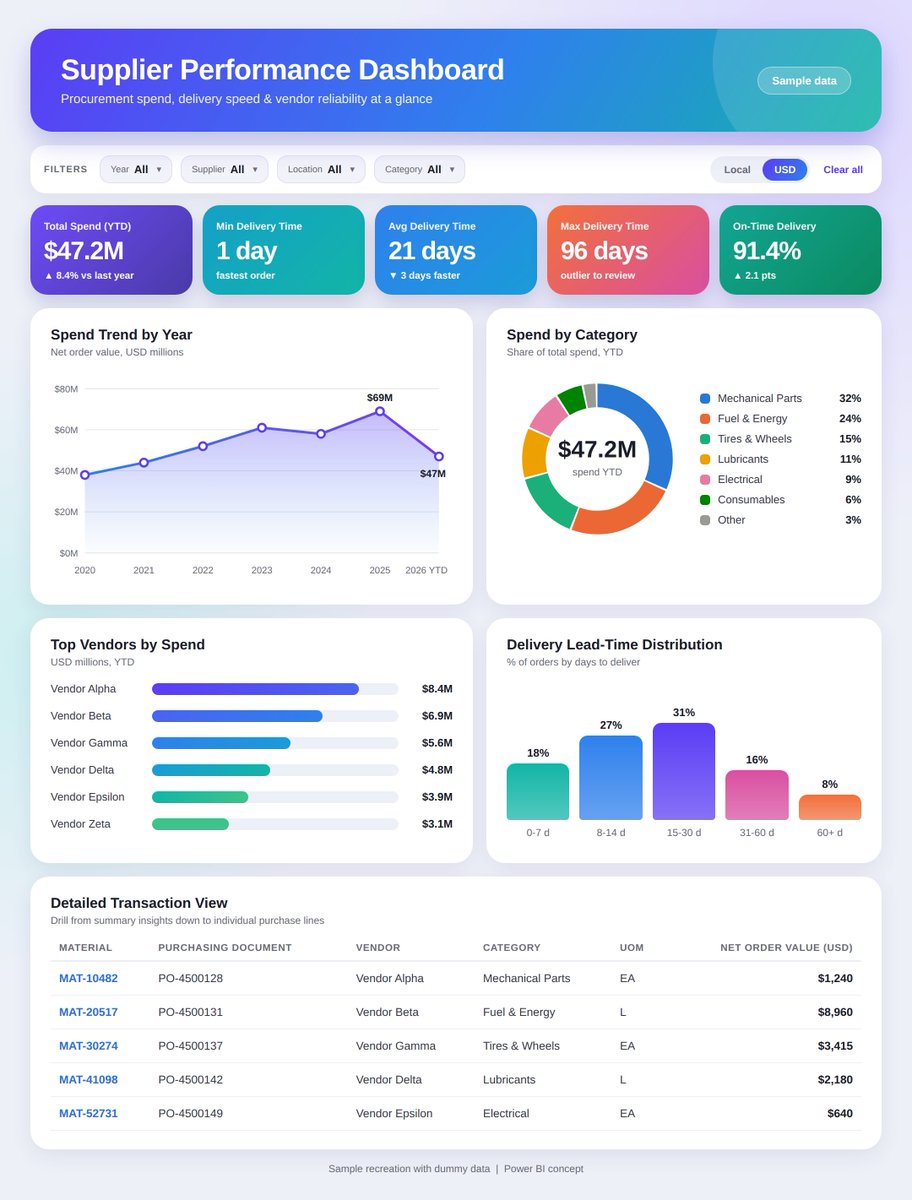
Bringing Supplier Performance and Purchasing Analysis Together with Power BI
One of the Power BI dashboards I worked on was a Supplier Performance Management Dashboard, built to give a consolidated view of purchasing activity and supplier performance.
(Note: the visual shared here is a sample recreation with dummy data, as the original is confidential.)
In procurement, looking at supplier performance in isolation is not always enough. The business also needs visibility into:
How much are we purchasing?
Which categories contribute most to purchasing value?
How is purchasing changing over time?
What is the average supplier delivery time?
Are there outliers in delivery performance?
Which suppliers, materials, or commodities need further analysis?
Key areas covered in the dashboard:
Purchasing Value Analysis: available in both local currency and USD
Delivery Time Analysis: minimum, average, and maximum delivery time to spot patterns and outliers
Category-Level Analysis: from high-level categories down to commodities
Yearly Trend Analysis: how purchasing activity changes over time
Flexible Filtering: by Year, Supplier, Location, and Product Category
Detailed Transaction View: Material, Purchasing Document, Vendor, Category, UOM, and Net Order Value
On the development side, the focus was not just on visuals. The solution involved:
Data → Transformation → Data Modeling → DAX → Interactive Visuals → Business Insights
The goal was to let users move quickly from "What is happening?" to "Where is it happening?" to "Which supplier or category is contributing?" and finally "What needs further investigation?"
A good procurement dashboard is not just about displaying purchasing numbers. It should connect purchasing value, supplier activity, category analysis, and delivery performance to support faster business decisions.
What do you look for first in a procurement dashboard: spend, supplier performance, or delivery time?
#PowerBI #DataAnalytics #ProcurementAnalytics
A material goes out of stock at your terminal.
The work can't wait. So where do you find it?
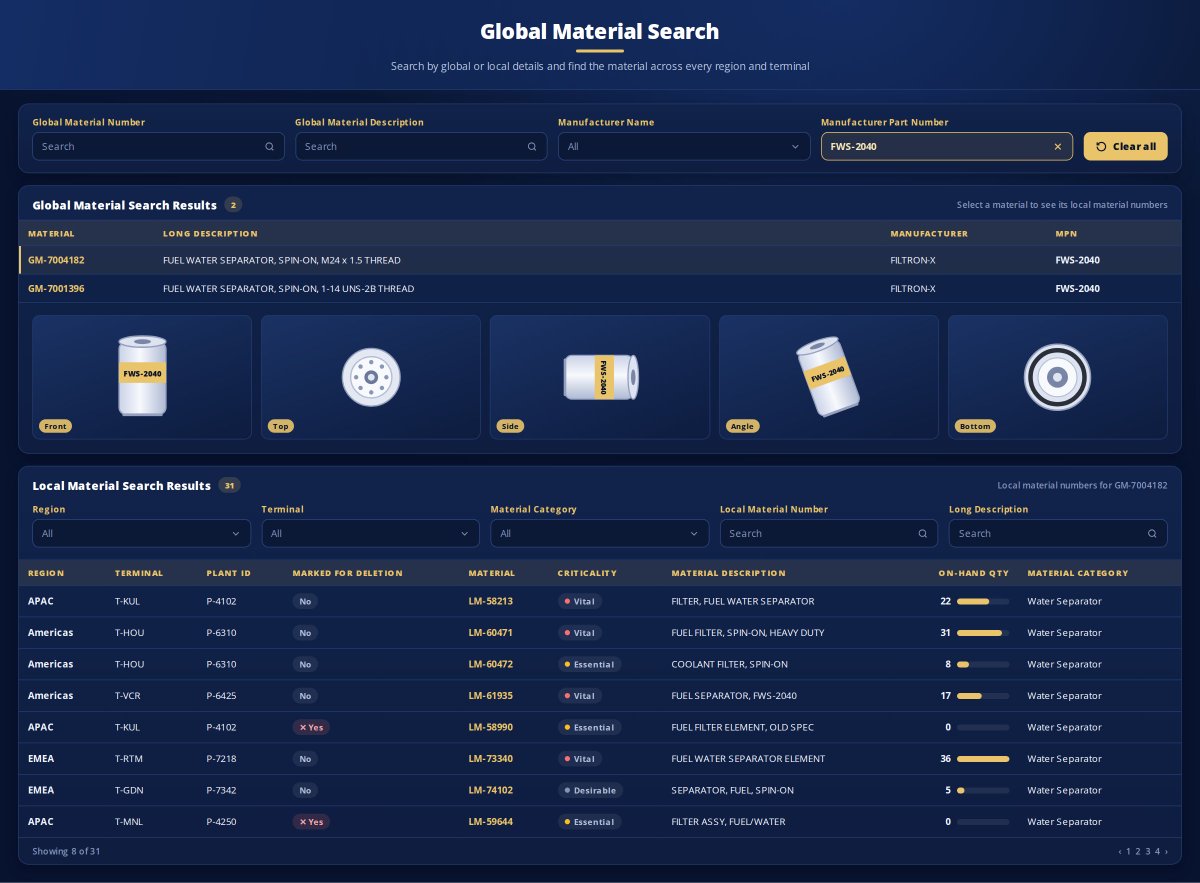
That was the problem behind one of the Power BI dashboards I built: a Global Material Search Dashboard.
The situation
In large organizations, the same material can exist across multiple regions and terminals, but each location may use a different local material number.
So when a terminal runs out of a part, finding the same material somewhere else in the network can become difficult.
How the dashboard helps
1) Search the way you know the material
Users can search by Global Material Number, Global Material Description, Manufacturer Name or Manufacturer Part Number (MPN).
They can also search using Local Material Number or Local Material Description.
2) Find the global material
The search results show the matching global material along with its description, manufacturer and MPN.
3) Confirm it's the right part
Material images are displayed to help users visually verify the item before taking further action.
4)See where the material exists
Selecting a global material shows the related local material numbers across regions, terminals and plants.
5) Check availability
For each location, users can see:
✅ On-hand quantity
✅ Material criticality
✅ Marked-for-deletion status
✅ Material description
Users can also filter by Region, Terminal and Material Category to narrow down the results.
The result
Instead of searching through multiple sources or contacting different terminals individually, users get a consolidated view of where the material exists and its available quantity.
A good dashboard doesn't always need dozens of charts.
Sometimes, one well-designed search experience can solve a very real business problem.
Note: The visual shown is a redesigned version with dummy data to protect client confidentiality.
#PowerBI #DataAnalytics #SupplyChain
Knowing a PR or PO was created is easy. Knowing where it's stuck, and for how long, is the hard part.
So I built a Procure-to-Pay dashboard in Power BI that tracks the full lifecycle: PR Creation → PR Approval → PO Creation → PO Approval → GR → Invoice
Every stage is shown on a timeline: 🟢 Completed
Pending / In progress
Overdue / Delayed
It answers three questions:
- Where is the process pending?
- Which approval stage is causing the delay?
- How much time was spent at each stage?
What it covers:
- PR & PO creation and release tracking
- Multi-level PR and PO approval tracking
- Lead time between stages
- GR and invoice status
- Pending delivery quantity
- Pending invoice quantity and value
- Search by PR/PO number
Stack: SQL → Power Query → Data Modeling → DAX → Power BI
Most of the work went into reshaping raw procurement data so the full PR → Invoice lifecycle and the time between each stage could be calculated.
For me, this is where Power BI adds real value: not just showing data, but helping teams find bottlenecks and act on them.
#PowerBI #Procurement #DataAnalytics
I turned my resume into a Power BI dashboard.
6+ years, 14+ dashboards, 3 onsite engagements (Iraq and Papua New Guinea), and PL-300 certified. Procurement, inventory and warehouse analytics is where I work best.
Open to Data Analyst / Power BI roles let's connect.
Power Query tip:
Got months as columns?
Jan | Feb | Mar...
Select them → Unpivot Columns
Wide data → clean rows.
Much easier to analyze and build visuals in Power BI.
#PowerBI#PowerQuery
DAX tip:
Instead of:
Revenue / Orders
Try:
DIVIDE([Revenue], [Orders], 0)
It safely handles 0 or blank values and helps avoid divide-by-zero issues.
Small tip, but useful in real Power BI projects.
#PowerBI#DAX