Crypto conviction should come with a checklist.
At MoveDecoder, we track:
• BTC structure & invalidation levels
• ETH/BTC & altcoin participation
• ETF flows & liquidity
Charts show the scenario. Data tests it.
Follow for sourced weekly maps, clear confirmation conditions and updates when the evidence changes.
Start with our latest market map, technical levels and sources:
https://t.co/QJYILKVQrM
bitcoin:native $ETH
Altcoin rally: September 17–30 is the window I'm watching.
September 20 is the first confirmation checkpoint.
This week's evidence:
• BTC spot ETFs: +$986.7M
• ETH spot ETFs: +$215.3M, down 74% week-on-week
• Stablecoin supply: +$1.65B over 7 days
• CMC Altcoin Season Index: 40/100, up from 32
• ETH/BTC: 0.03083, down 0.9% this week through Friday
Liquidity is improving. A broad altcoin rally still needs stronger ETH leadership.
My activation conditions:
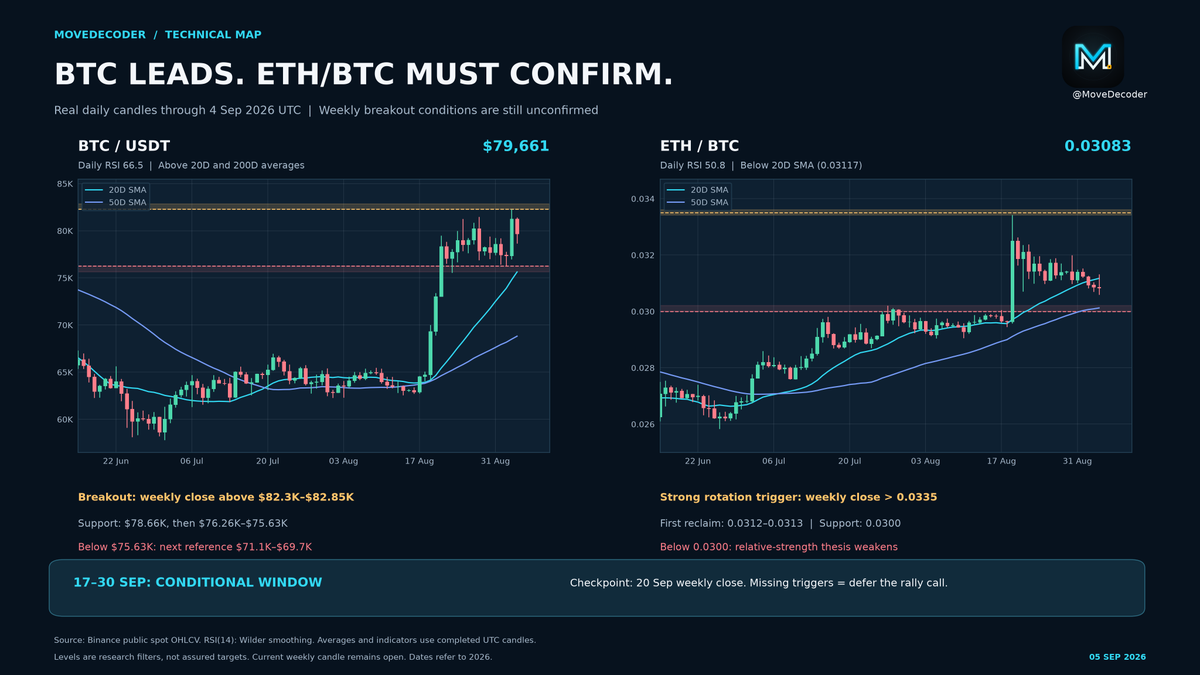
1. BTC weekly close above the $82.3K–$82.85K resistance zone.
2. ETH/BTC weekly close above 0.0335.
3. Broader participation and a sustained decline in BTC dominance (now 59.4%).
Why these dates?
Sep 11 CPI → Sep 16 Fed decision → Sep 20 first post-Fed weekly close. Sep 30 PCE adds another test.
This is a conditional scenario window, not a statistically established start date. If the triggers are missing, the rally call waits.
BTC below $75.6K or ETH/BTC below 0.0300 would weaken the near-term setup.
Data as of Sep 5, 2026. ETF week: Aug 31–Sep 4. Technicals use completed daily candles through Sep 4 UTC. The weekly candle is still open.
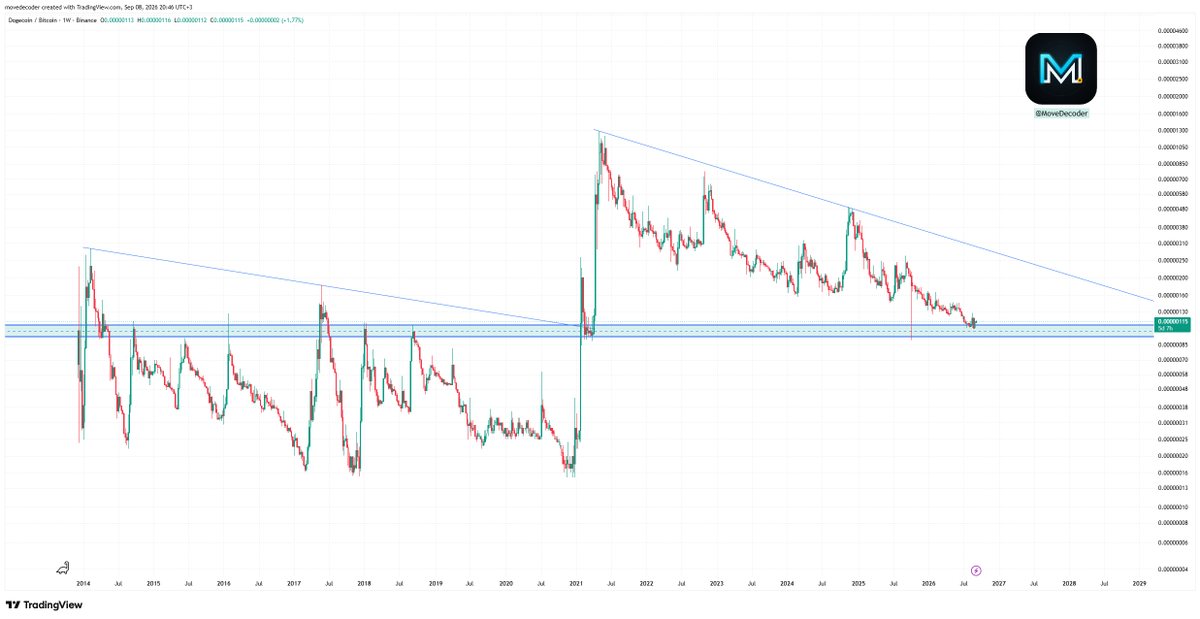
#DOGE/BTC is sitting at a very important long-term level.
Price has returned to the 0.00000095–0.00000120 BTC zone, an area that has acted as a major pivot for more than a decade.
Before 2021, this region repeatedly acted as resistance. After the 2021 breakout, DOGE/BTC is now testing the same area from above as long-term support.
However, there is still one major issue:
Since the 2021 peak, DOGE/BTC has continued to form lower highs. The macro downtrend remains intact, and this support zone has already been tested several times.
So the setup is simple:
• If this historical support holds: this could become a major long-term accumulation/reversal zone for DOGE relative to BTC.
• If ~0.00000095 is lost on weekly closes: it would represent a significant breakdown of a structure that has been relevant for many years.
For now:
Strong location. Weak structure.
A real bullish confirmation would require DOGE/BTC to start reclaiming key levels and eventually break the sequence of lower highs.
This is one of the most important areas on the DOGE/BTC chart to watch.
@CoinMarketCap For crypto users, a familiar voice or video isn't enough to authorize a transfer. Verify urgent requests through a separate, established channel—and check what a wallet signature actually permits.
@Washigorira Is this based on a closed monthly candle, or the current month's reading? A useful distinction: an intramonth crossover can reverse before the close.
@DaanCrypto How does the median L2/DeFi token compare with the sector average? That would help separate broad participation from a few leaders pulling the group higher.
@TedPillows Liquidation clusters are potential pressure points, not a fixed price route. They can shift as positions open or close. The reaction at a cluster matters more than assuming every bright band must get swept.
@CW8900 Useful distinction between easing selling and new buying. I'd watch whether spot demand actually turns positive before reading the futures strength as a broader demand recovery.
Your altcoin can rally and still lose ground to Bitcoin.
Example, over the same period:
Altcoin: +12% in USD
BTC: +20% in USD
Altcoin/BTC: -6.7%
1.12 / 1.20 - 1 = -6.7%
A green USD chart shows a gain. The BTC pair shows whether it beat the benchmark. Check both.
bitcoin:native $ETH
Altcoin rally: September 17–30 is the window I'm watching.
September 20 is the first confirmation checkpoint.
This week's evidence:
• BTC spot ETFs: +$986.7M
• ETH spot ETFs: +$215.3M, down 74% week-on-week
• Stablecoin supply: +$1.65B over 7 days
• CMC Altcoin Season Index: 40/100, up from 32
• ETH/BTC: 0.03083, down 0.9% this week through Friday
Liquidity is improving. A broad altcoin rally still needs stronger ETH leadership.
My activation conditions:
1. BTC weekly close above the $82.3K–$82.85K resistance zone.
2. ETH/BTC weekly close above 0.0335.
3. Broader participation and a sustained decline in BTC dominance (now 59.4%).
Why these dates?
Sep 11 CPI → Sep 16 Fed decision → Sep 20 first post-Fed weekly close. Sep 30 PCE adds another test.
This is a conditional scenario window, not a statistically established start date. If the triggers are missing, the rally call waits.
BTC below $75.6K or ETH/BTC below 0.0300 would weaken the near-term setup.
Data as of Sep 5, 2026. ETF week: Aug 31–Sep 4. Technicals use completed daily candles through Sep 4 UTC. The weekly candle is still open.
The technical test:
BTC closed Friday at $79,661. Daily RSI: 66.5. The $82.3K–$82.85K supply zone still needs a weekly reclaim.
Support: $78.66K, then $76.26K–$75.63K.
ETH/BTC closed at 0.03083, below its 20-day average. First reclaim: 0.0312–0.0313. Stronger rotation trigger: a weekly close above 0.0335.
The charts use real Binance daily candles through Sep 4 UTC. Sep 20 is the first weekly checkpoint after the Fed—not an assured rally start.
@triremetrading $80K is the headline, but reclaim quality is the real signal. Spot-led volume, stable funding and OI that does not expand too quickly would make the move more durable.
@lukasz_wydra Important nuance: improving premium is not the same as positive premium. Negative exchange netflow suggests reduced sell-side supply, but a durable U.S. bid still needs persistent premium and ETF follow-through.
@VoidOnChain The $2.1K–$2.2K inefficiency is worth tracking, but not every FVG must fill. A 4H close below the last higher low plus weakening spot CVD would make the pullback case much stronger.
@whale_alert A Coinbase Institutional deposit is not automatically sell pressure. The better tell is whether exchange balances rise and the Coinbase premium weakens afterward. Follow-through matters more than the transfer headline.
@CW8900 A positive premium matters only if it persists through the U.S. session. Pair it with sustained spot volume and ETF inflows; one green print alone can still be noise.
@Wealthmanager The divergence is constructive, but the weekly close matters more than the intraday reclaim. If price closes above the 50W MA while OI stays controlled, that would argue for a spot-led recovery rather than another leverage squeeze.
@bespokeinvest $IBIT above $46.47 would be useful confirmation because it tests whether the BTC move is translating into ETF demand. A close above it on volume matters more than a brief intraday print.
Regulatory clarity could become a genuine liquidity catalyst—but only if the final text gives issuers and exchanges predictable SEC/CFTC boundaries. Passage is the headline; implementation is the market-moving detail.