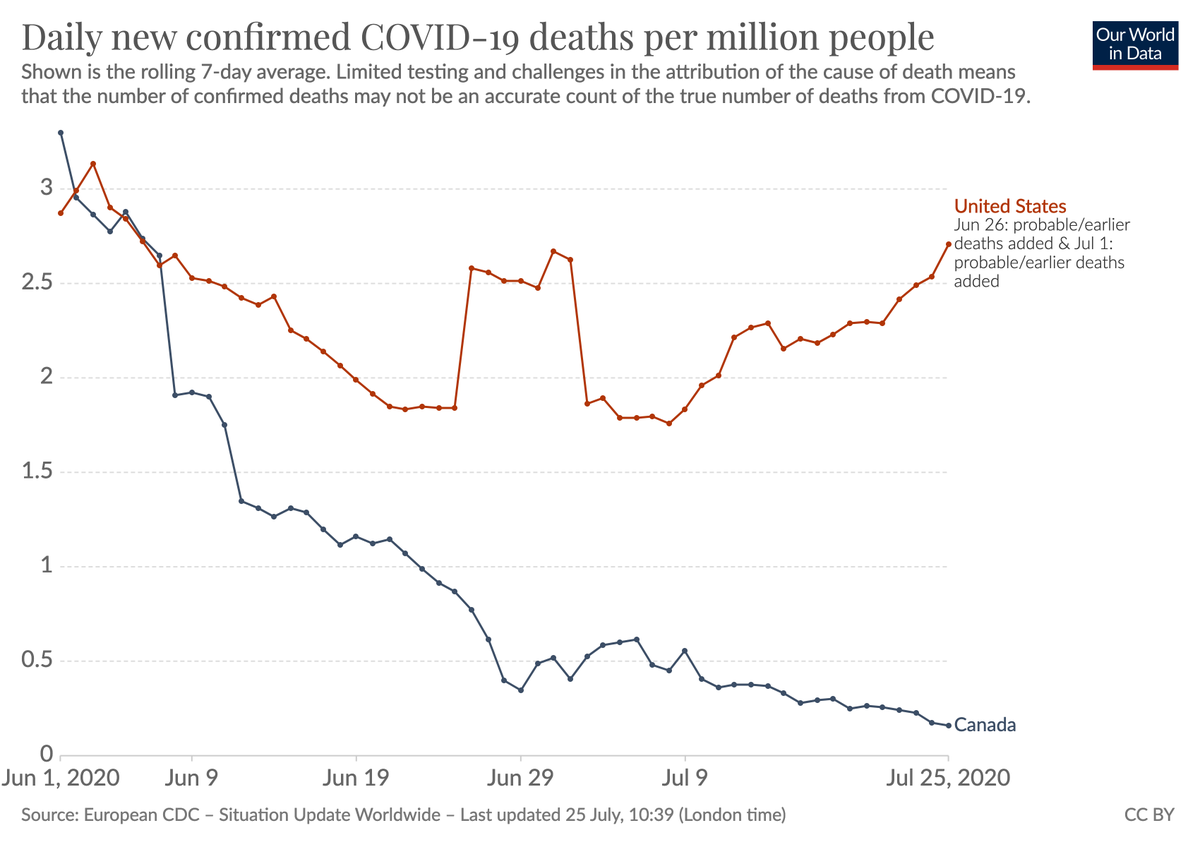
As recently as the beginning of June the US and Canada had the same death rate.
While the US is unfortunately getting back to the rate from back then, Canada achieved a 20-fold reduction of the death rate at the same time.
https://t.co/wU7x3bOYk7
Hey Blazers, Crusaders, Lions and Mustangs! So impressed with the work you’re putting in to your games during the long days of summer! Don’t forget, as Jack Armstrong might say, to ��get that garbage outta here’ too. #proudcoach @BayridgeSS_LDSB @Gr33nArmy @LancasterPSLDSB
We rebuilt our work on the pandemic: https://t.co/8HhFFxXTAS
At its heart is now the tool that you see in the video – our new #COVID19 Data Explorer.
If you want to understand the global pandemic we hope the new site and the new Explorer are useful for you.
Hey parents! If your kids are stuck on a homework question, feel free to pass this message along. Because as a teacher, I want to help out. Let me know what the difficult question is by replying to this tweet or using the hashtag #CanadaHomeworkHelp - and I’ll see what I can do.
Congrats to Victoria, the Beacon of Hope recipient @alcdsb_shrt. Victoria is a leader & mentor to younger students at Sacred Heart Catholic School on Wolfe Island. She does her best each and every day and helps to make the school the positive place that it is. Thank you Victoria!
To give false hope to Ontario students & their families that iPads are being purchased to mitigate inequity & access gaps, only to be referring to iPads already in circulation in school boards - with no new funding to purchase more - is a shameful PR stunt by @Sflecce
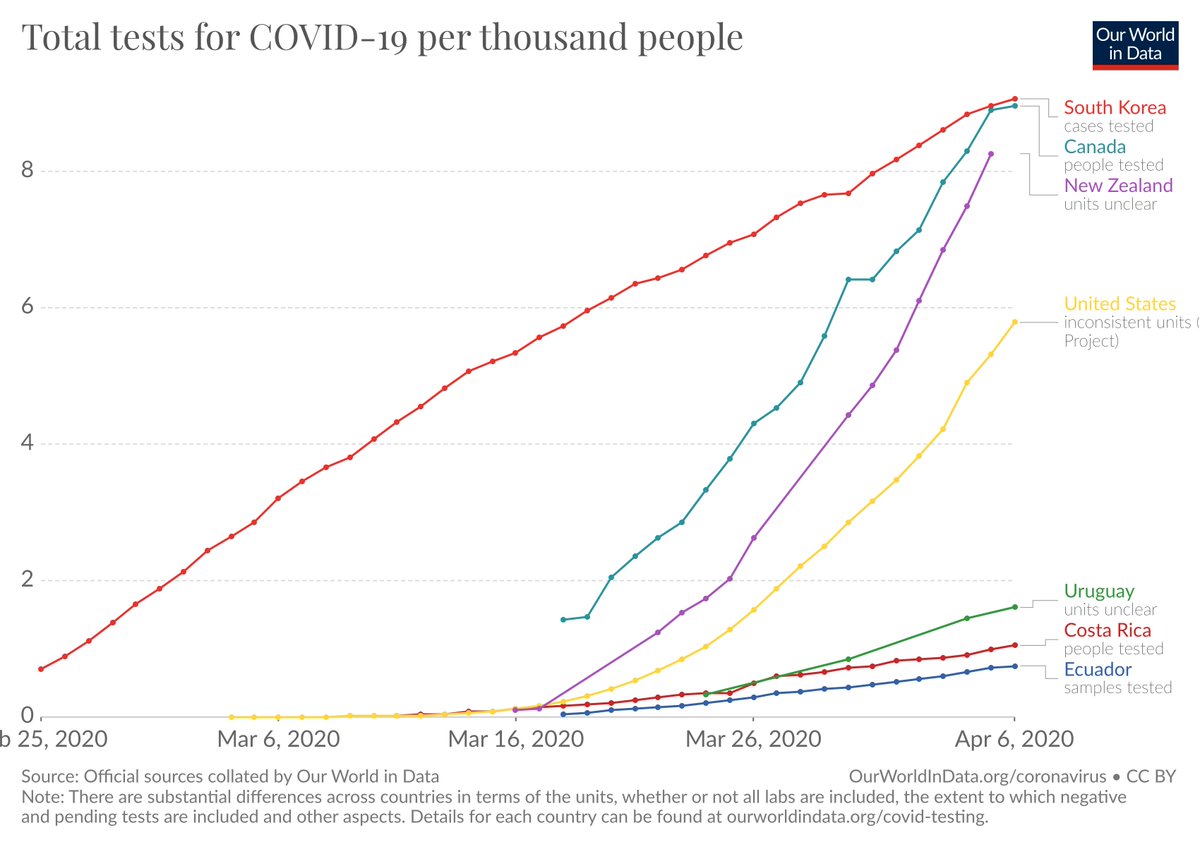
The latest update of our COVID-19 testing data is out:
https://t.co/Nf7it1GEIT
Canada and New Zealand are expanding testing rapidly.
Canada is now catching up to Korea in the number of total tests per 1000 people of the population.
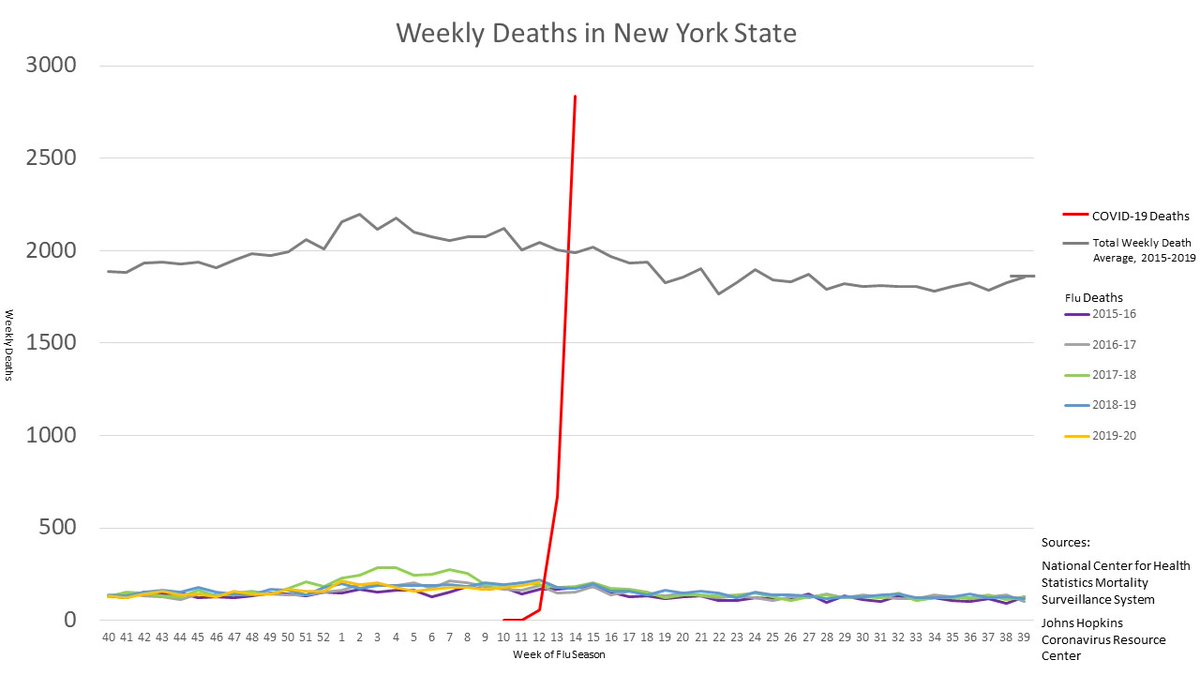
– The grey line shows the number of deaths in New York State in 2015-18
– The colored lines at the bottom are deaths from the flu in past years
– In red is the number of confirmed deaths from the pandemic
Data: JHU & CDC https://t.co/wVplFnSo4r
Author: https://t.co/wUQMtuzz79
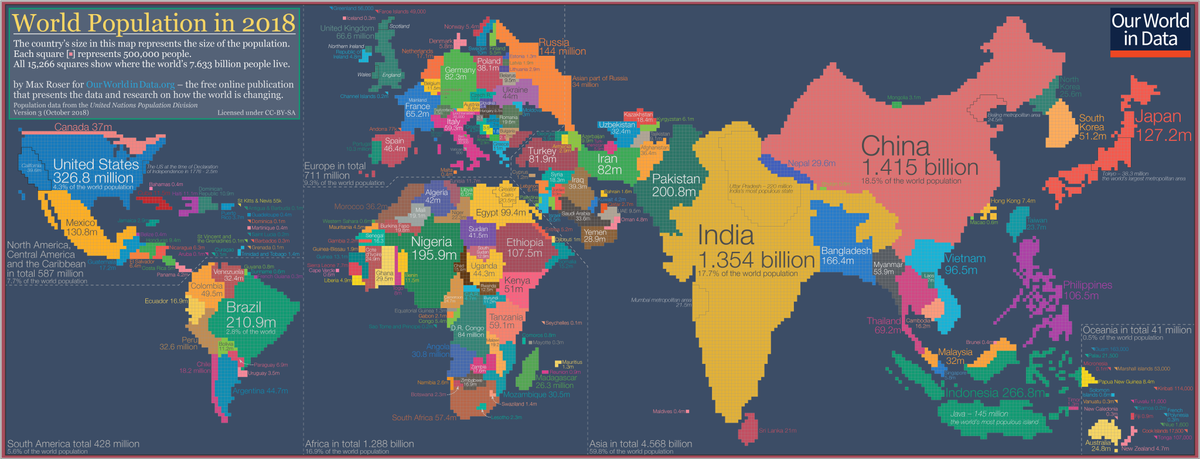
Where does the world population live?
To find an answer I made this cartogram.
The number of squares per country corresponds to the population of that country. And each square represents half a million people.
Here is the big version: https://t.co/leShXOWzq4
How do the trajectories of different countries compare?
A very good version of this chart by the Datawrapper team:
https://t.co/sLCoQA1XBz
@Datawrapper is an extremely useful, free visualization tool.
There is no excuse for the poor presentation of the data in the news media.
How rapidly is the number of confirmed COVID-19 cases rising in different countries?
Since a minute ago we have a chart that allows you to answer this question.
You find it here https://t.co/8HhFFxXTAS
Big thanks @danielgavrilov.
You did a lot of hard work these weeks!
“Which part of this is aimed at improving the quality of education in Ontario? To me it looks like someone is looking at this to save money, not to do what real kids actually need.” #OSSTF President, @HarveyBischof#onted#onpoli#NoCutsToEducation https://t.co/WCoeP5mADf
Teachers didn’t vote for a strike and you know it. They voted to give our team a mandate to bargain for what matters to all of us - smaller class sizes and supports for our most vulnerable students. You don’t speak for parents. You don’t even listen to them.
The CRCA has created Lake Assessment Reports for 45 lakes in the region These fact sheets provide maps, note the physical features, assess water quality, identify the invasive species and outline aquatic diversity. https://t.co/aI8SO1p8rZ #WeAreConservation