Reversals
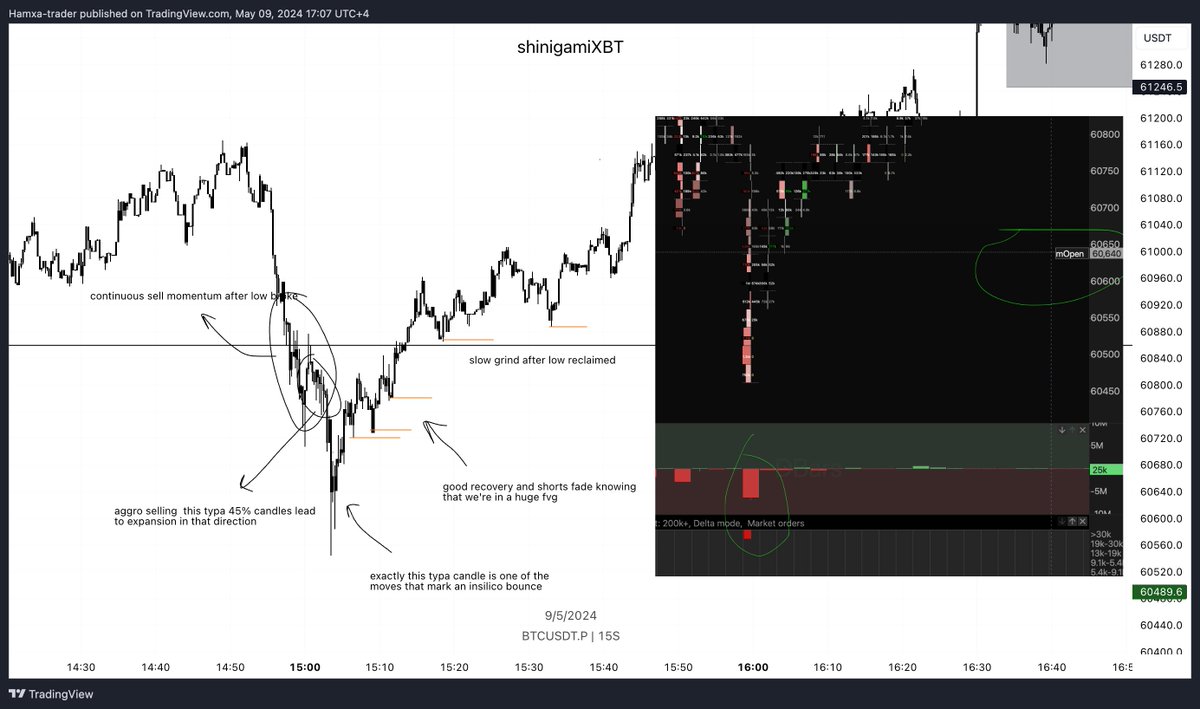
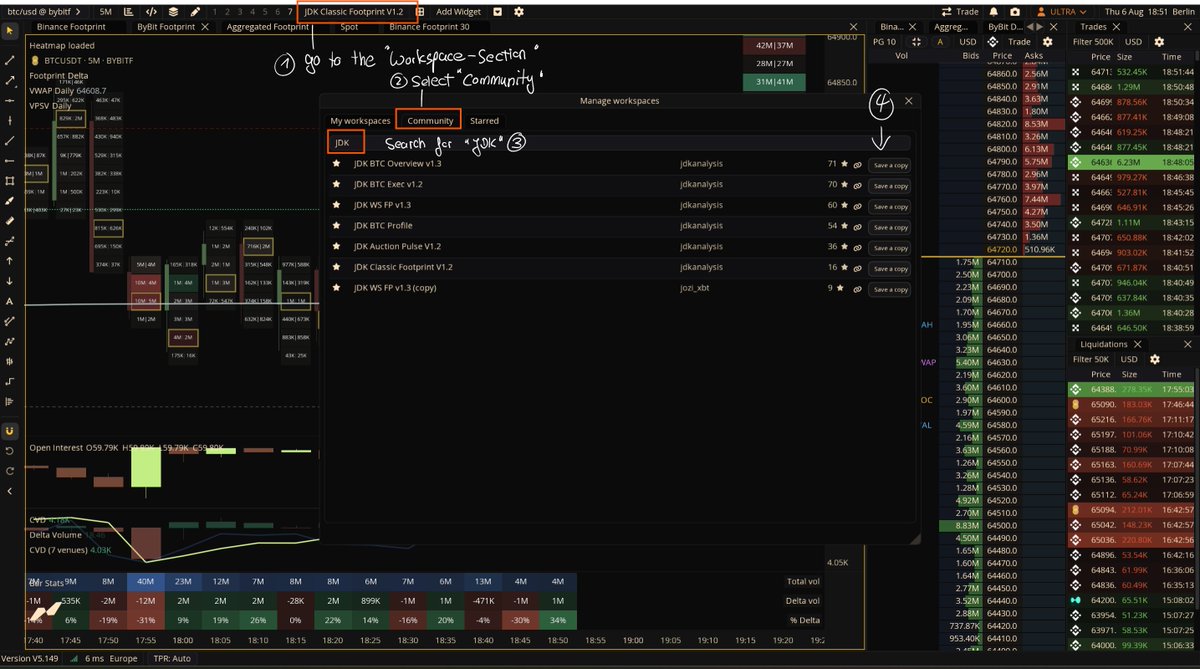
Built a little something on MMT that highlights specific candles that I look at for reversals.
for those interested...
- follow & like this post
- send me a DM with "indicator"
script + info will be sent to a select few in the next week.
...an example candle ↓
Front runs
When price just misses your level by a few ticks. (def)
Interest and strength of the level die, leaving lower chances of a good reaction.
I prefer to remove pending orders from levels that have been front run until space has been created.
...illustration below ⬇
Volume profile
Determining where a range begins and ends can be tricky.
The process for me is simple. Looking for and identifying the imbalance is what's key.
An imbalance highlights an attempt to auction out of range.
...how to read and pull ↓
Open Interest
The relationship between opening and closing contracts.
Important for understanding market sentiment.
Covering a complete break-down of how and why local interest inside a market operates as it does.
… a frame-work to open interest ↓
Buyers absorption
Looking for order book resistance.
I like to use CVD alongside price action, to find any divergences with market structure. Works well alongside confluence.
By comparing the delta it takes to move price a given distance.
...an explained break-down ↓
Most traders think they struggle because of limited resources,
when the underlying problem is themselves
winning first comes by having the mental fortitude to execute a system consistently.
new tools will not make a profitable trader, discipline does.
Practice that first
You can read the auction in real time too! 🔬
🧵 In the thread below, I’m sharing all my main $BTC OrderFlow chart templates - ready to load on your own device, customize to your preferences, or just see exactly what I see on @MMT_Official_.
No account yet? Sign up through my link. Enough sign-ups by month-end will help unlock exclusive discounts in the near future 🔥👇
🔗 https://t.co/zIqXYTnqHh
🔸 CVD:
Shows the imbalance between aggressive buyers and sellers over time.
Rising CVD = more market buying
Falling CVD = more market selling
🔸 Open Interest (OI)
Shows whether new positions are entering the market.
Rising OI = new positions being opened
Falling OI = positions being closed
-> combine CVD and OI;
CVD ↑ + OI ↑ → new longs
CVD ↑ + OI ↓ → shorts closing
CVD ↓ + OI ↑ → new shorts
CVD ↓ + OI ↓ → longs closing
🔸 Price
The final validator. It tells you if the aggression is actually moving the market.
→ Combine CVD, OI and Price to see who is in control:
> If positioning (CVD + OI) aligns with price → continuation likely - strong move.
> If positioning builds but price doesn’t follow the aggression → absorption → trapped traders → reversal potential!
Want to take better trades and avoid the bad ones?👀
(Don't miss this!)
Let’s talk about how to use OrderFlow as trade confirmation at key levels; 👇
When price reaches a key support or resistance level, most traders already have a bias. OrderFlow shifts your focus away from prediction or hope and toward real-time validation.
Instead of assuming your level will hold, you observe what participants are actually doing the moment price interacts with it. Are aggressive traders able to push price through? Or are they being absorbed?
1) At resistance:
✅ We take the short if…
Aggressive buyers step in (market buys), but price doesn’t push higher → clear absorption by passive sellers (effort ≠ result).
Wait for sellers to respond and trap those longs.
When they exit, their market sells fuel the move down.
→ OrderFlow shows: rising CVD + rising OI while price stalls = bearish absorption
❌ We avoid the short if…
Aggressive sellers pile in at resistance, but price keeps grinding higher or holds strong.
Those shorts are getting absorbed by passive buyers → building fuel for continuation to the upside.
→ OrderFlow shows: falling CVD + rising OI while while price holds below resistance = bullish absorption
2) At support:
✅ We take the long if…
Aggressive sellers step in (market sells), but price doesn’t push lower → clear absorption by passive buyers (effort ≠ result).
Wait for buyers to respond and trap those shorts.
When they exit, their market buys fuel the move up.
→ OrderFlow shows: falling CVD + rising OI while price holds the level = bullish absorption
❌ We avoid the long if…
Aggressive buyers step in at support, but price keeps moving lower or fails to bounce.
Those longs are getting absorbed by passive sellers → building fuel for continuation to the downside.
��� OrderFlow shows: rising CVD + rising OI while price holds weak at support = bearish absorption.
The key principle: effort vs. result.
We don’t need to predict new buyers or sellers entering the market. We focus on what’s already happened -> traders stuck in losing positions 👀
Their exits are predictable market orders we can anticipate, and those market orders often drive the next move.
Using OrderFlow helps you take higher-quality trades at your key levels, and avoid the bad ones.
But always remember; profitability comes from discipline and risk management! Not from better entries.
Xphere Content Challenge Event 🔥
We are hosting a Twitter content creation challenge event based on XPHERE’s Mainnet and the XPHERE ecosystem DApps
https://t.co/8idmF33SYL
We will select a total of 16 winners with a prize pool of 1,500 USDT.
Please create in-depth content about XPHERE’s Mainnet and the ecosystem DApps (@Xeffy_io , @xaxtrading, @Pixie_Pocket_ etc.
post it on Twitter, and submit your entry via the Google Form!
I've received a lot of requests from users wanting to easily check the number of holders and detailed reward info for the XAX staking event. To make things easier, I've just deployed a dashboard site!
🔗 https://t.co/75Wm40iPso
You can now view the compiled data for the top 1 to 50 holders alongside their designated rewards.
I hope you all find this website super useful!
Please note that since this is a self-made personal site for user’s convenience, the site might experience slow or even crash if there's a huge spike in daily traffic. Thank you so much for your understanding in advance!
Appreciated.
Orbition is growing.
45,308 users have joined the ecosystem.
40,554 nodes are currently active in the AI Mining and Node Lending phase.
This is still the early phase of Orbition as we continue building toward decentralized AI infrastructure.
Join our Telegram community and follow official updates:
Community:
https://t.co/AMqXjj1w7e
Official Announcements:
https://t.co/9GuNhDz5nB
What is AI Mining?
AI Mining uses AI algorithms to identify and allocate available distributed node resources through the Node Lending system.
Once allocated, nodes automatically participate in the network, removing the need for users to deploy or manage infrastructure manually.
Explore AI Mining:
https://t.co/X5fLv09J2u
Node Lending is a mechanism where the network provides users with access to distributed compute nodes, allowing them to participate without needing to operate their own infrastructure.
Something special is coming.