Pattern on bitcoin:
Top to top: around 1430 days: 2013 ➡️ 2017 ➡️ 2021 ➡️ 2025. Repeated 3 times
Bottom to bottom: around 1430 days: 2014 ➡️ 2018 ➡️ 2022. Repeated twice
Bottom to top: around 1064 days: 2015-2017, 2018-2021, 2022-2025. Repeated 3 times
Top to bottom: around 364 days: 2017-2018, 2021-2022. Repeated twice
Check the graph yourself and verify it. Obviously the first cycle we could not know this, the second cycle might have been coincidence, but after the third it is obvious a pattern is here
Paterns tend to change of course, not a lot of datapoints, but still…
If all this repeats, bottom is in October 2026, looks to be going that way again
I recommend losing it all at a younger age, you’ll still experience huge personal losses at some point in your life anyways, the earlier/faster the better
“Claude can now open apps, navigate your browser, fill in spreadsheets - anything you would do sitting at your desk.”
That’s literally all of white-collar work.
It is over.
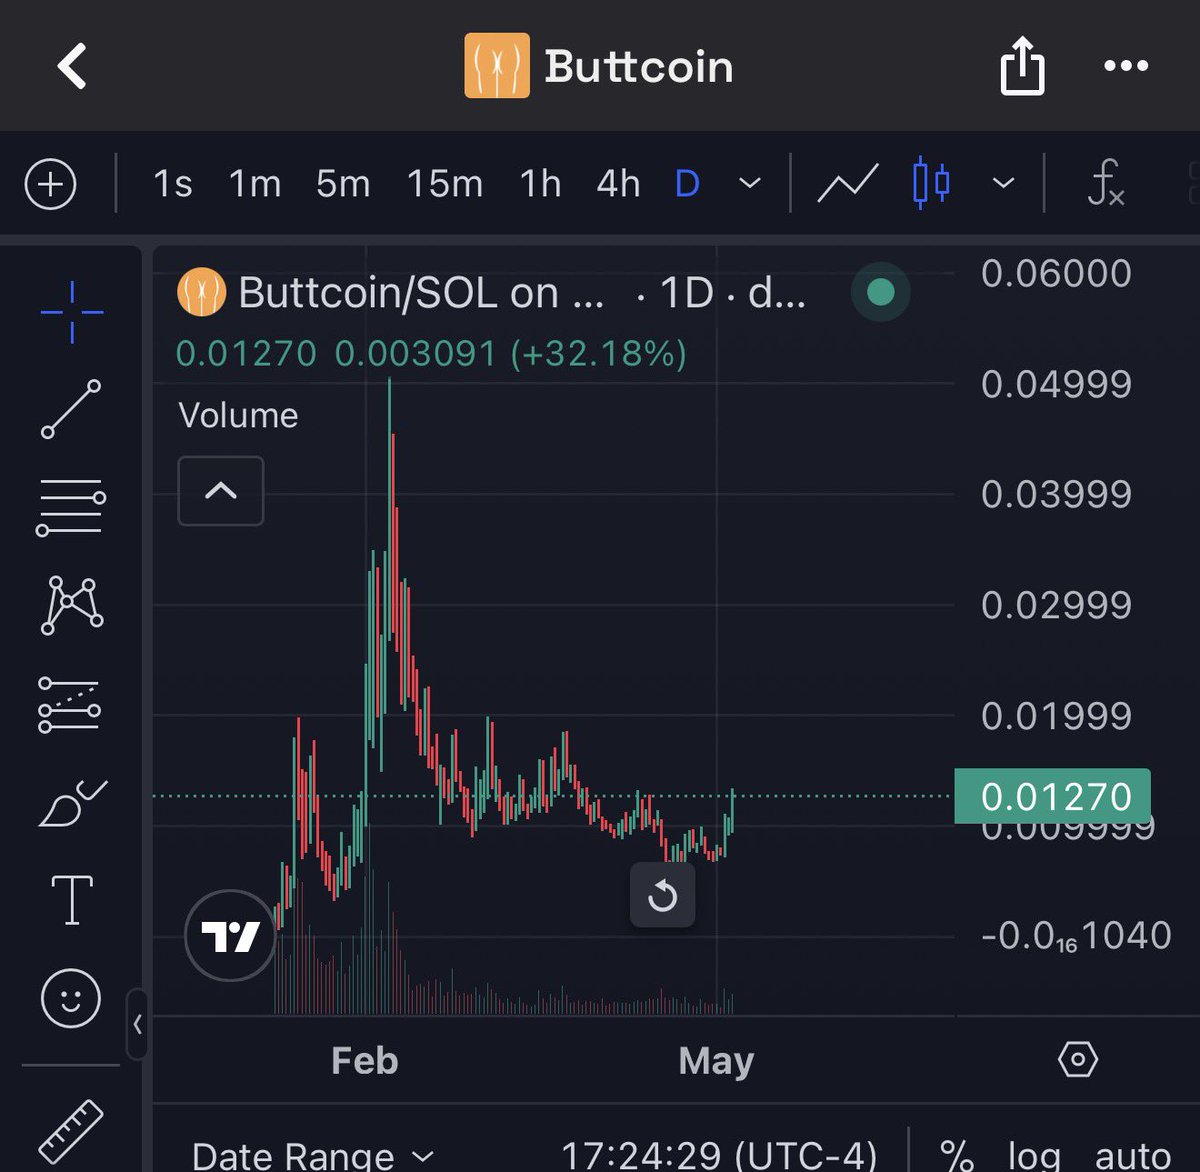
crazy it feels like we might be back
but the ~365 days from btc top to bear market bottom prophecy is strong
its held true every other cycle
why would it break now??????
dca spot + hold, dont sell anything is my approach
if the prophecy is true again the bottom is in october
we will see
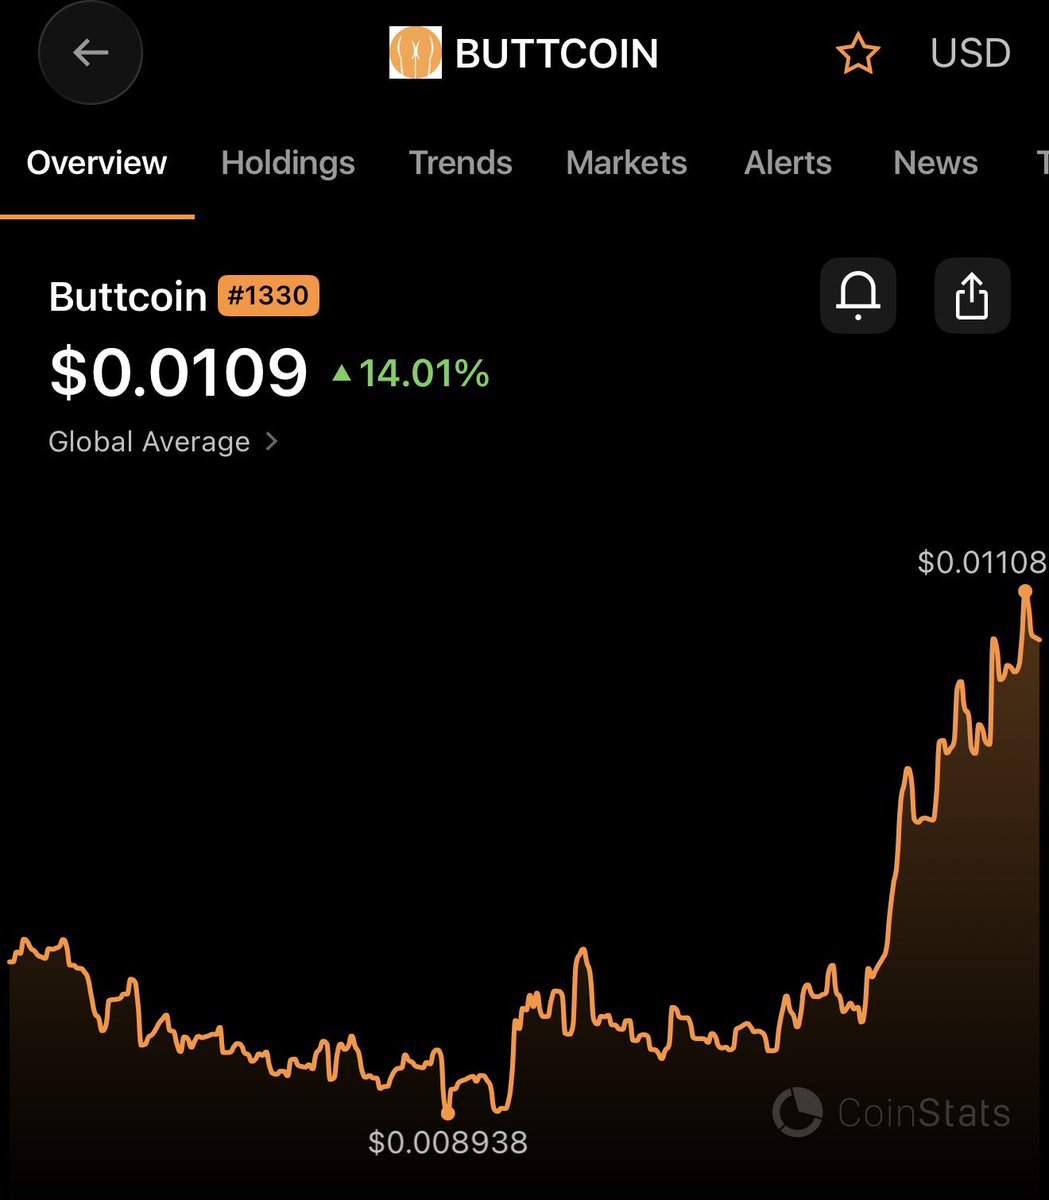
still a good place to dca btc or hype here imo
by the time $btc hits a new ath $hype will be $200+
some thoughts for u on this fine day
tldr = dca and chill
we might be back or we might not be 😂