Three years ago I published the Qullamaggie deep dive research bundle
@TheShortBear called it the best thing since Tim Grittanis work was shared
With the help of AI I've now made it into an interactive app
Let me know if you want a discount code 👇
@RealSimpleAriel Good observation.
But money is flowing into select sectors/stocks.. and the rotation is quite messy as there's a lot of players and not happening very fast
Qullamaggie said the same about Wayfair in 2020. He tried shorting it 10 times first though..
"Like if you have a stock that's up 900% in a few months and the market weakness can't bring it down, the stock is trying to tell you something. It's yelling at you."
https://t.co/0gGOb3lHXJ
"The best trades will be yelling at us"
But @Qullamaggie tried to short Wayfair 10 times..
Before he finally bought it and made $600,000 in a month..
Follow his play-by-play trade breakdown 👇
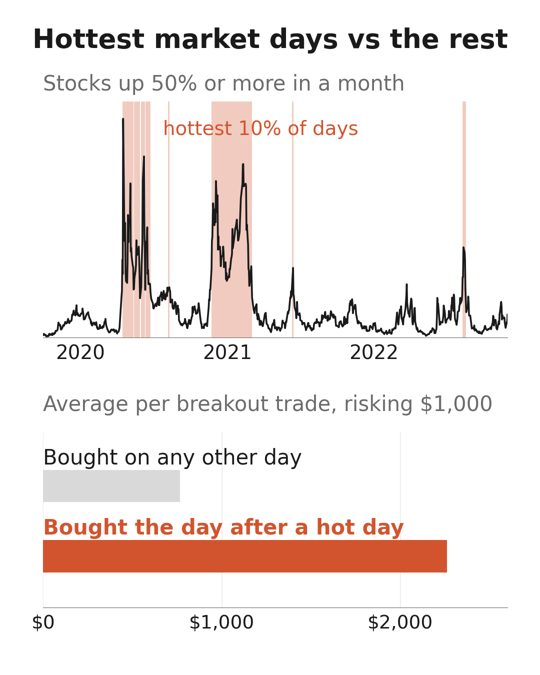
A hot day is when a lot of stocks are already flying. 145 or more US stocks up 50%+ over the last 21 trading days (price $1+, $1M+ traded a day), which was the top 10% of days from 2018 to 2022.
I read it the evening before and count Qullamaggie's breakouts bought the next day.
Hot days are per definition the top 10%
Breakouts during the hot markets has about the same win-rate as other periods. But the winners are much bigger.
@NickSchmidt says "Opportunities come in windows", and when "everyone is making money" he makes sure to press aggressively..
Checked the results for Qullamaggies trades in the hottest periods of 2019 to 2022..
Win rate: 23% vs 27%
Avg. winner: 0.76R vs 2.26R
The biggest improvement for me over time has been understanding that not every moment in the market is equal. Opportunities come in windows. Most traders dont recognize the windows they are just focusing on setups.
When its easy and "everyone is making money" the key has been approaching that window extra aggressively because I know the window will close again. And when it closes making sure I step back and understand I cant trade like I was when it was open.
Every model book trade looks obvious once you know how it ended.
So I built a simulator based on Market Wizard Kristjan Qullamaggie. 1,300+ of his real trades, each frozen where he decided.
You make the call, then you see what he did.
The best part of building it has been the messages.
One trader wrote that it "forces you to make decisions on borderline setups." That is the whole reason it exists. A surprising number of his trades aren't pretty.
Also available for parabolic shorts and EPs📈
This time the generals are what's falling. The rest of the market is fine.
The typical stock (the equal-weight S&P) is about as close to its high as SPY. Health care and staples are at highs. The AI names are doing all the damage.
The opposite of spring 2014, when the big caps held SPY up and the momentum names got hit.
https://t.co/ELIn5lapIX
Even after making millions, @Qullamaggie kept asking "Where do we sell?"
He made over $5,000,000 on Tilray in 2021, selling "too early".
Here's his play-by-play. Would you have waited?
Even after making millions, @Qullamaggie kept asking "Where do we sell?"
He made over $5,000,000 on Tilray in 2021, selling "too early".
Here's his play-by-play. Would you have waited?
Moving your stop to breakeven when you're up 3-4R is indifferent.
1,625 of 6,150 breakouts got to +3R. Moving the stop to entry saved 354 that came back (+349R), and stopped out 136 that would have done better (-425R).
Same story at +4R.
So.. its a breakeven decision.
If your trade is up 3 to 4R and you still haven't moved your stop to b/e, you almost deserve to watch it come all the way back and stop you out.
That's like winning the lottery, refusing to cash the ticket, and then complaining when you lose it.
@Wordsofrizdom@JLawStock Great! Can’t wait for this one!
I’ve checked some of his stuff - but most of it was pretty basic. Hopefully you’re going into details and real edge
This is based on a dataset of profitable traders - low six figures to high eight figures.
Not wildly different after 2020. In every year from 2019 to 2026, moving the stop to entry at +4R made less than 0.04R a trade of difference. About nothing.
The three years it came out behind, one big winner got stopped at entry each time..
Same trade every year. Lots of small saves, and now and then it costs you a 15R to 50R winner.
@HeymixMadteenz@Qullamaggie Thanks heymix!
Too long to admit..
To be honest I am not sure if its worth it. Very helpful for me to go through the trades in detail, but putting all of together takes more time than I care to admit and I couldve spent it on other things..
@TK9397870121699 I see what you’re saying..
But winrate is actually surprisingly agnostic to these things.. but how far they go is a completely different story
A tight stop isn't always best.
Qullamaggie's tightest stops got taken out 81% of the time.
His widest, 64%.
One of the questions traders ask most is where the stop should go.
I split his stops in terms of how wide they were..
Tightest third: a median 1.3% below, 17% winners.
Widest third: 4.8% below, 28% winners.
It's all connected and we can't have our cake and eat it too
@invertedfragil1@PradeepBonde It's a cliff, not a gradial change..
Run-up in the month before the report:
Down 10%+: +0.05R
Down 5-10%: 0.00R
Down 0-5%: +0.04R
Up 0-5%: +0.01R
Up 5-10%: 0.00R
Up 10-20%: +0.14R (but mostly noise)
Up 20%+: -0.40R
From -10% to +20% it's all noise around zero..
Neglect or negative price action in the prior month is one of the best filters for earnings reactions.
Earnings beat, revenue beat, guidance change, gap size.. it doesn't matter compared to the price action in the prior month.
@PradeepBonde says "If a stock is rallying in to catalyst it has high probability of failure."
I've tested this across our tradable universe. Stocks that ran 20% or more in the month before the report averaged -0.40R a trade. Everything else: +0.04R.
If you want to know why it's like this let me know..
One simple filter eliminates most EP, prior price neglect. If a stock is rallying in to catalyst it has high probability of failure.
Look at $RKLB recently. Was going sideways for months pre breakout and gaps up slightly on earnings plus theme catalyst. Did 50% plus in few days. That is what to look for. Very few stock meet that criteria.
Now days I see many uninformed traders calling any gap as EP without using neglect as qualification so everything is EP to them and as a result high failure.