Behold the AWESOME 'OI Snapshot Scroller' feature. You can scroll and check out the OI changes between any two specific time periods. If more puts have been added than calls (Bullish) during that time period then slider color changes to Blue, else Pink (Bearish). Happy trading.
There is a screen for tracking straddle prices, allowing you to monitor price movements. For example, you can see below how the Fin Nifty 24000 straddle started around 100 and trading now around 10.
https://t.co/KZ7gGm7VZC
Nifty - only if combined premium of 25500 CE and 25500 PE crosses 210 or goes below 200 then only we may see a trading move in Nifty...
Please check out straddle chart here
https://t.co/k7O3MVf5ls
We are currently experiencing issues with Google Authentication that may affect your ability to register or log in using Google. We are actively working with Google to resolve this matter, but we do not have an estimated time for when the issue will be fixed.
1/2
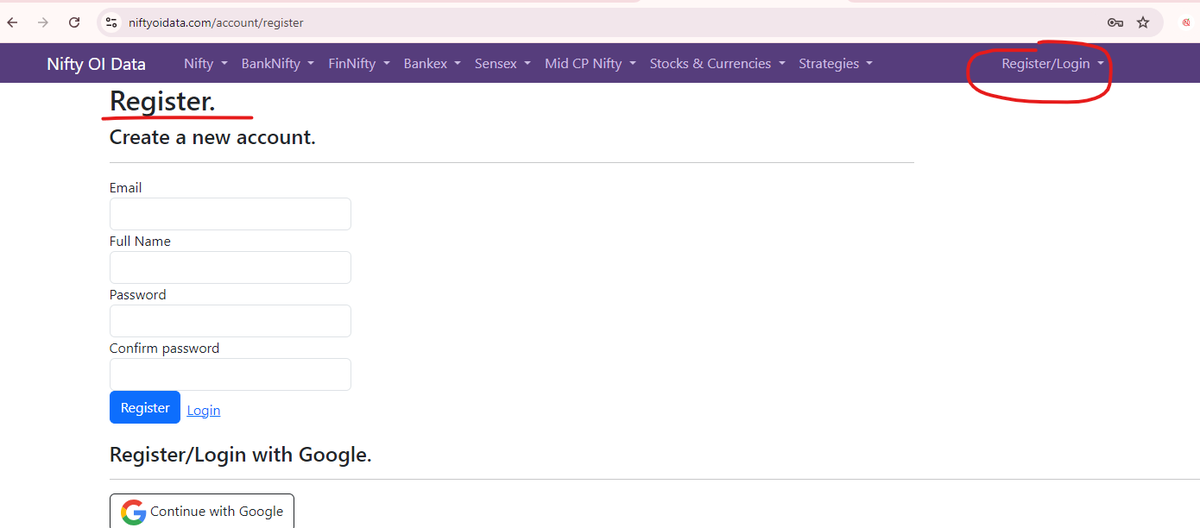
The issue still persists. We have created register/login forms using email.
Incase, if anyone wants to register with an email, please register it here
https://t.co/lCvTUrRHLG
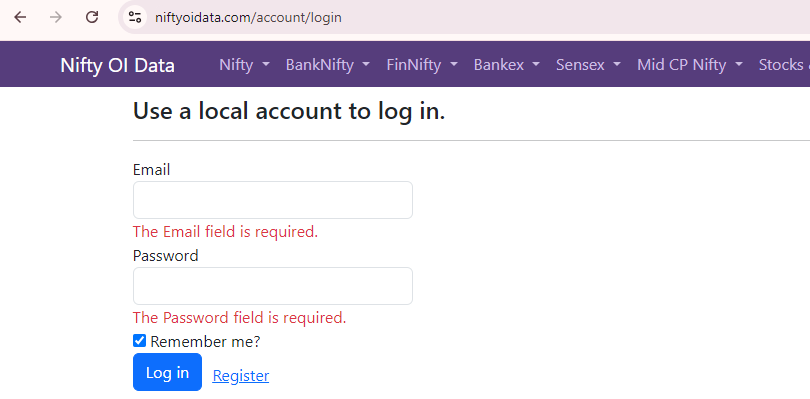
once register you can login using below link
https://t.co/RieYilJbsq
Hello!
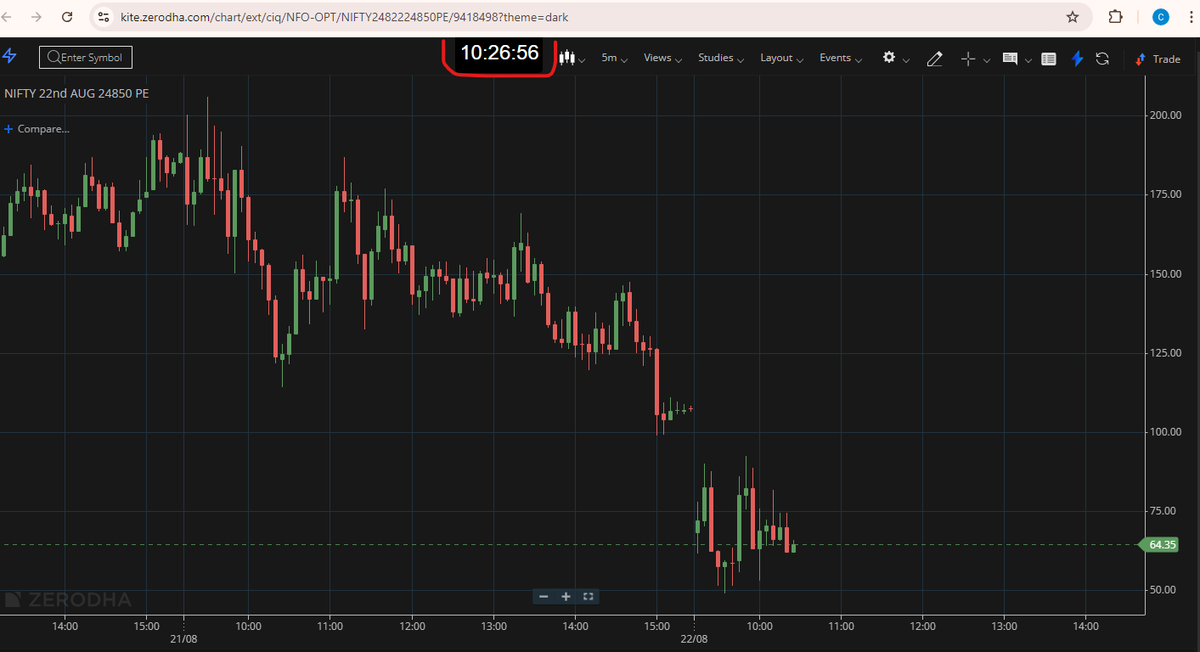
I have developed a chrome extension to display digital clock(time including secs) on Zerodha kite pages. It is easy to track Market open (09:15)/Market close(3:30pm)/candle closing while placing a trade on kite pages itself
You can get it from here
https://t.co/fKke4pUo4H
The issue still persists. We have created register/login forms using email.
Incase, if anyone wants to register with an email, please register it here
https://t.co/lCvTUrRHLG
once register you can login using below link
https://t.co/RieYilJbsq
Starting from August 30th, we will introduce an ad-free subscription service that includes access to live Open Interest (OI) data and charts. Free users will continue to have access to OI data and charts, but with delayed data, limited features, and advertisements
#NiftyOiData
Behold the AWESOME 'OI Snapshot Scroller' feature. You can scroll and check out the OI changes between any two specific time periods. If more puts have been added than calls (Bullish) during that time period then slider color changes to Blue, else Pink (Bearish). Happy trading.