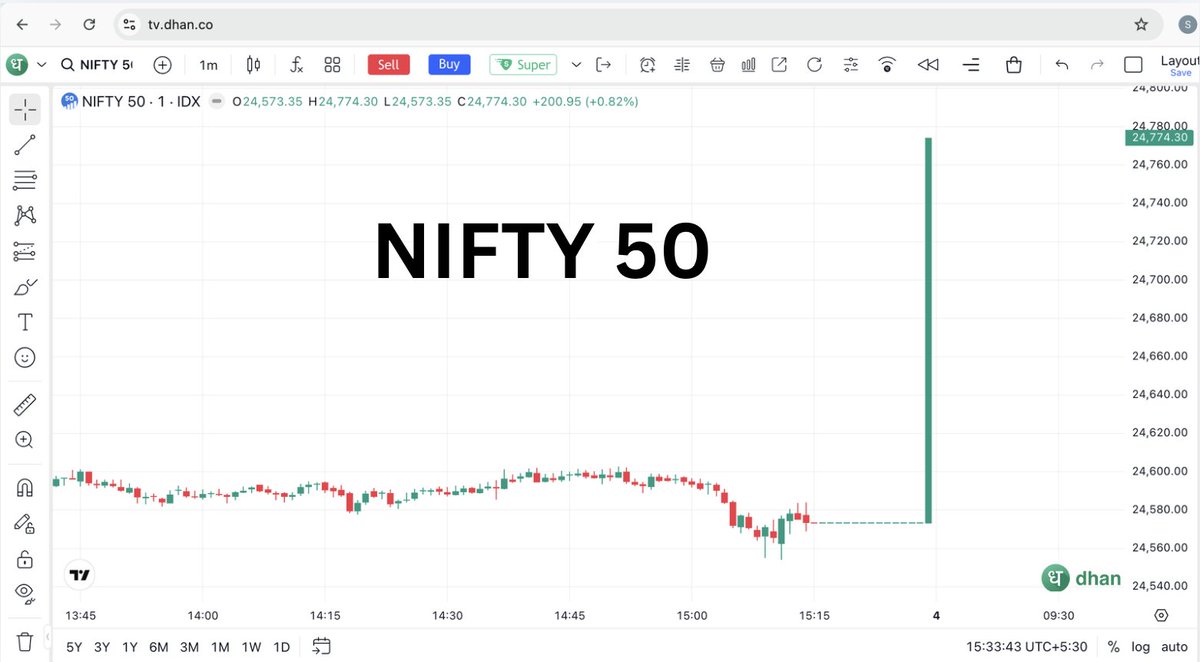
Yesterday, traders celebrated a +200 point Nifty spike in the last few minutes.
Today, many realised...
It wasn't a fresh wave of buying.
It was largely the impact of the new closing auction mechanism, which changed how closing prices are discovered. The one-time distortion got unwound the very next day, catching many traders on the wrong foot.
The takeaway?
Don't build your market view based only on the last 15–20 minutes of trading anymore.
Sometimes, the chart is showing a rule change, not a trend change.
That's the difference between reacting to noise and understanding the market.
Restaurant Brands Asia (Burger King India) was one of today's biggest movers, jumping around 16% after its Q1 results.
So, what changed?
✅ The company reported a much lower quarterly loss than last year, and that's exactly what the market liked.
This is a good reminder that the market reacts to improvement, not just profits.
But one good quarter doesn't mean the turnaround is complete.
If you're tracking this stock, keep an eye on:
• Same-store sales growth
• EBITDA margins
• Net profit over the next few quarters
That's where you'll know whether today's rally has real strength behind it.
#IndianStockMarket #Stocks #Earnings #RestaurantBrandsAsia #BurgerKingIndia
Why Small Caps Rose While Nifty Fell
The Nifty was in the red.
But many small-cap stocks ended higher.
At first glance, this looks contradictory.
the Nifty declined as heavyweight sectors like IT and financials came under pressure. At the same time, the small-cap index gained, outperforming the benchmark.
This happens because market indices are weighted.
A few large companies can pull the Nifty lower, even while hundreds of smaller companies are advancing.
Investor takeaway:
Never judge the entire market by looking only at the Nifty or Sensex.
Always check:
• Market breadth (advances vs. declines)
• Mid-cap and small-cap performance
• Sector-wise trends
Sometimes, the headline says "market fell", while a large part of the market is actually doing well.
A fund with 100 stocks isn't automatically safer than one with 40.
Many investors think:
"More stocks = Lower risk."
Not necessarily.
Imagine this:
Fund A
• Holds 40 stocks
• Top 10 holdings = 52% of the portfolio
Fund B
• Holds 100 stocks
• Top 10 holdings = 58% of the portfolio
Despite owning 100 stocks, Fund B is actually more concentrated in its biggest bets.
Instead of counting holdings, check:
✅ Top 10 holdings weight
✅ Sector concentration
✅ Market-cap allocation (Large/Mid/Small)
✅ Portfolio turnover
A portfolio with fewer, high-quality businesses can sometimes be better diversified than one with dozens of tiny positions that barely move the needle.
The distribution of the portfolio matters far more than the number of stocks.
When you evaluate a mutual fund, do you check how many stocks it owns or how much it has invested in its top holdings?
🚨 Every Indian investor has that one friend...
📉 During a crash:
"Bro, I'm waiting for lower levels."
📈 After a 20% rally:
"Bro, I think it's too late now."
The market doesn't transfer money from the impatient to the patient...
It transfers money from the waiting to the doing. 😅
Tag that friend who has been "waiting for the right entry" since 2023.
#Nifty #Sensex #StockMarket #Investing #IndianMarkets
@AdityaPatil3613@DealsDhamaka Just because some other country also has it, india should tax same? How does it makes sense? Are we blindly following or copying tax systems from other countries?
LIC stake sale is back in focus. Why does it matter?
The Government is planning to reduce its stake in LIC to meet public shareholding requirements.
Many investors assume:
Government selling = Bad news.
That's not always true.
Here's what it actually means:
• The sale increases free float in the market.
• Higher free float can improve liquidity.
• Better liquidity can increase the stock's chances of attracting larger institutional participation over time.
• The company's fundamentals don't automatically change because the government sells a portion of its holding.
Investor takeaway:
Whenever you hear "Offer for Sale (OFS)" or "stake sale", don't panic.
First ask:
✅ Is the business deteriorating?
or
✅ Is it simply a change in ownership structure?
Those are two very different events.
For educational purposes only. Not investment advice.
Thousands of listed companies report profits.
Very few grow them consistently.
A simple filter that helps eliminate many weak businesses:
✅ 3-Year Profit CAGR > 20%
✅ Revenue CAGR > 15%
✅ ROE > 18%
✅ Debt/Equity < 0.5
✅ Positive Free Cash Flow in recent years
Why this combination matters:
• Profit growth alone can come from cost-cutting.
• Revenue growth alone doesn't always create shareholder value.
• Strong businesses usually grow sales, profits, and cash flows together.
⚠️ One more check:
If profits are growing much faster than sales for several years, investigate why. It could be genuine operating leverage—or a one-time boost that's not sustainable.
The goal isn't to find companies with one impressive metric.
It's to find businesses with consistent, high-quality growth.
For educational purposes only. Not investment advice.
From October 1 , 2028 all newly manufactured vehicles will be required to come factory fitted with compliant V2V communication systems.
Automakers will be legally required to install certified On Board Units directly onto the vehicle assembly line.
#auto#v2v
Why did the Nifty suddenly jump around 200 points at the close today?
Many traders thought it was a glitch.
It wasn't.
Here's what actually happened. 👇
📌 What happened?
Today (3 Aug 2026), NSE implemented the new Closing Auction Session (CAS) mechanism for eligible stocks.
This was the first trading day under the new closing-price methodology.
📊 Market Reaction
• Nifty 50 closed at 24,774.30 (+1.6%)
• Sensex closed at 78,639.03 (+0.7%)
• Smallcap Index: +1.3%
• Midcap Index: +1.2%
The unusually large difference between Nifty and Sensex at the close triggered confusion across X and trading communities.
📌 Why did it happen?
SEBI's new Closing Auction Session (CAS) replaced the earlier closing price calculation based on the last 30-minute VWAP.
Now, the closing price is determined through a dedicated end-of-day auction designed to improve price discovery and reduce end-of-day manipulation.
This was a market structure change—not a technical glitch.
📌 Was it only because of CAS?
No.
Today's rally was also supported by:
✅ Brent crude falling about 5%
✅ Positive Q1 earnings
✅ Strong IT sector performance
✅ Continued FII buying
✅ Lower global bond yields
So the closing auction affected how prices were discovered, while broader market fundamentals supported the rally.
📌 What should investors watch next?
• Whether closing-day volatility normalizes over the coming sessions
• Liquidity during the auction window
• Any further operational guidance from NSE/SEBI
Takeaway:
Not every unusual market move is manipulation or a system error.
Sometimes the market is simply adapting to a new trading mechanism.
Nifty corrections happen almost every year.
The numbers tell a very different story. 👇
📉 Over the last 10 years, the Nifty has experienced 10 corrections of 10% or more.
That's roughly one major correction every year.
But here's what most investors miss:
📊 Average correction: 15.1%
📉 Excluding the COVID crash, the average correction falls to ~11–12%.
➡️ Most market corrections are far smaller than the headlines make them seem.
History after a 10%+ correction:
✅ 13 major drawdowns (>10%)
📈 11 out of 13 delivered positive returns one year later
🚀 9 out of those 11 produced double-digit returns
📊 Average 1-year return after these drawdowns: 21%
The long-term perspective:
📈 Average rebound over 6 months: ~32%
📈 Average rebound over 12 months: ~57%
(Past performance is not a guarantee of future returns.)
Takeaway:
A 10–15% correction is normal market behavior—not an exceptional event.
History suggests that investors who stay invested through corrections have generally been rewarded over the long term.
A mutual fund that beats its benchmark by just 2% every year can create ₹1+ crore of extra wealth over 30 years.
Example:
• Monthly SIP: ₹20,000
• 12% CAGR → ~₹7.06 crore
• 14% CAGR → ~₹8.87 crore
Difference: ~₹1.81 crore
That's the power of just 2% annual alpha.
This is why smart investors don't chase last year's top-performing fund.
They look for funds that consistently generate alpha across market cycles while managing risk.
Question:
If a fund cannot consistently beat its benchmark by even 2%, why pay an active fund manager instead of investing in a low-cost index fund?
This is not Bitcoin, DogeCoin, or a Penny Stock
This is Nifty closing 200 points higher in the Closing Auction Session introduced by SEBI from today onwards
A 1% higher annual return changes everything.
₹10,000/month SIP for 30 years
📈 11% CAGR → ₹2.81 crore
📈 12% CAGR → ₹3.53 crore
💰 Difference: ₹72 lakh
Just 1% extra annual return can create nearly ₹72 lakh more wealth over the long term.
That's the power of compounding.
Focus on consistent long-term returns, not short-term performance.
🇮🇳 India's Oldest Equity Mutual Funds — Did Age Translate Into Wealth?
Most investors chase the newest "top-performing" fund.
But what if we looked at the funds that have survived for 30–40 years?
Here's the data:
Rank| Mutual Fund| Launch Date| Age| Since Inception CAGR*
🥇 1| UTI Large Cap Fund (formerly UTI Mastershare)| 15 Oct 1986| ~40 Years| 15.35%
🥈 2| SBI Magnum Equity ESG Fund| 1 Jan 1991| ~35 Years| ~14–15%
🥉 3| UTI Flexi Cap Fund| 30 Jun 1992| ~34 Years| ~17–18%
4| Franklin India Large Cap Fund (formerly Bluechip)| 1 Dec 1993| ~32 Years| 18.26%
5| Franklin India Prima Fund| 1 Dec 1993| ~32 Years| 18.77%
The biggest surprise?
❌ The oldest mutual fund didn't generate the highest CAGR.
🏆 Among these veteran funds, Franklin India Prima Fund has delivered the highest long-term compounding at 18.77% CAGR, despite launching 7 years later than India's oldest equity fund.
Lesson:
«Longevity builds trust.
Performance builds wealth.
The best investment isn't always the oldest—it's the one that compounds consistently across decades.»
*Returns are since-inception annualized returns based on the latest available fund disclosures and may vary slightly with the NAV date used.
The biggest mistake mutual fund investors make isn't choosing the wrong fund. It's ignoring valuation.
Two Small Cap funds:
• Fund A: 5-year CAGR = 29%
• Fund B: 5-year CAGR = 23%
Most investors instantly pick Fund A.
That's exactly how future returns get destroyed.
Instead of looking only at returns, check these 5 things:
✅ Current Portfolio P/E vs 5-year average
✅ Price-to-Book (P/B) vs history
✅ Cash allocation (Higher cash may indicate the fund manager isn't finding attractive opportunities.)
✅ Portfolio valuation compared to the benchmark
✅ Portfolio valuation compared to peer funds
Where can you check these for FREE?
• Morningstar India → Portfolio, holdings, valuation ratios (P/E, P/B), style analysis and comparison tools. "Morningstar India"
• Value Research Online → Portfolio, valuation metrics, rolling returns and peer comparison. "Value Research Online"
A fund that delivered the highest past return often holds the most expensive portfolio today.
Buying it may mean paying tomorrow's price with today's money.
Rule:
«Buy businesses at reasonable valuations—not yesterday's performance.»
Past returns tell you where the fund has been.
Valuation tells you what you're paying today.
Most investors chase winners.
Wealth creators buy value before everyone else notices.
Not investment advice. Do your own research.