𝙏𝙝𝙚 𝙗𝙞𝙜 𝟯 𝙞���� 𝙙𝙖𝙩𝙖 𝙖𝙧𝙚 𝙗𝙚𝙘𝙤𝙢𝙞𝙣𝙜 𝟰.
Data Analytics.
Data Science.
Data Engineering.
Analytics Engineering.
As AI makes data consumption easier, I believe building reliable data systems becomes increasingly valuable.
I’m betting on Data Engineering and Analytics Engineering.
Here’s why.
#Datafam #AnalyticsEngineering
𝙒𝙝𝙖𝙩 𝙩𝙝𝙚 𝙈𝙚𝙨𝙨𝙞 𝙫𝙨 𝙍𝙤𝙣𝙖𝙡𝙙𝙤 𝙙𝙚𝙗𝙖𝙩𝙚 𝙩𝙚𝙖𝙘𝙝𝙚𝙨 𝙪𝙨 𝙖𝙗𝙤𝙪𝙩 𝙙𝙖𝙩𝙖 𝙖𝙣𝙖𝙡𝙮𝙩𝙞𝙘𝙨.
Total goals vs. goals per game.
Total goal contributions vs. G/A per 90.
Same players, different metrics, different conclusions.
Numbers without context can be misleading, even when they’re correct.
And yes, I’m still picking Messi.
#Datafam #Data
Funny how the project that helped me land my first data analyst job was about The Real Housewives of Lagos. 😂
I analysed over 170K tweets, built a Power BI dashboard and shared it online.
And when I started going for interviews, this was what they wanted to talk about. Not my certificates. 😂
Don’t just build projects because everyone else is building them. Find something you’re genuinely interested in and explore it.
#DataAnalytics #PowerBI #DataAnalyst
"𝙞 𝙘𝙤𝙪𝙡𝙙 𝙣𝙚𝙫𝙚𝙧 𝙗𝙪𝙞𝙡𝙙 𝙩𝙝𝙖𝙩."
that is what most people think when they see work like this.
here is the part you don't see. the students who built these dashboards said the same thing before they started.
what they had on day one was a question they couldn't answer yet. that's all. then came the weeks of showing up, getting it wrong, and fixing it until the numbers told the truth.
𝙩𝙝𝙚 𝙜𝙖𝙥 𝙬𝙖𝙨 𝙣𝙚𝙫𝙚𝙧 𝙩𝙖𝙡𝙚𝙣𝙩. 𝙞𝙩 𝙬𝙖𝙨 𝙖 𝙨𝙩𝙖𝙧𝙩 𝙙𝙖𝙩𝙚.
cohort 10 has two.
ai-powered data analytics starts saturday 5 december. ₦89,999 / $89.99
register: https://t.co/nJ8pDJEc6e
analytics engineering starts friday 20 november. ₦150,000 / $150
register: https://t.co/kFln0Sj4cm
#Datafam
𝘿𝙖𝙩𝙖 𝙖𝙣𝙖𝙡𝙮𝙨𝙞𝙨 𝙘𝙖𝙣 𝙖𝙘𝙩𝙪𝙖𝙡𝙡𝙮 𝙗𝙚 𝙛𝙪𝙣!
Here’s a walkthrough of our final Power BI project with DWD Cohort 9.
From understanding the business problem to building an interactive dashboard that tells a story.
Did we cook? Let me know what you think.
#Datafam #PowerBi
The power BI section of cohort 9 has been purely value packed in all rounds.
To be frank, I didn't paid close attention to my tool(power BI) throughout the classes because knowledge comes first.
But when I eventually touch the tool, it will rain fire works.
𝙢𝙖𝙧𝙘𝙪𝙨 𝙝𝙖𝙨 𝙩𝙝𝙧𝙚𝙚 𝙤𝙣-𝙩𝙞𝙢𝙚 𝙧𝙚𝙥𝙤𝙧𝙩𝙨 𝙖𝙣𝙙 𝙩𝙝𝙧𝙚𝙚 𝙙𝙞𝙛𝙛𝙚𝙧𝙚𝙣𝙩 𝙣𝙪𝙢𝙗𝙚𝙧𝙨.
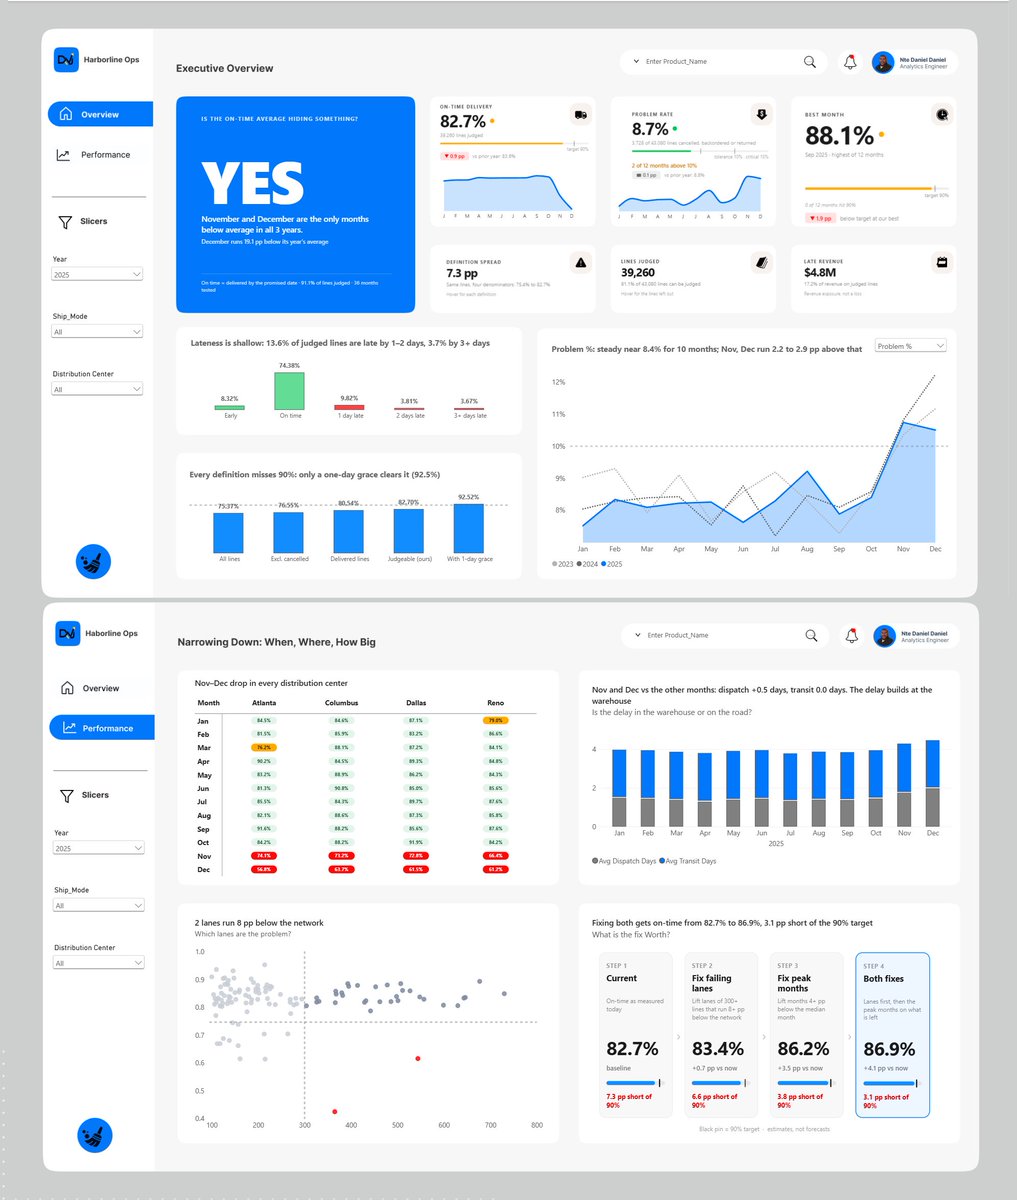
he runs operations at harborline distribution, a fictional company from our cohort 9 guided project. his monthly average hasn't moved in three years. his store managers insist deliveries are getting worse.
someone is wrong. our students had to find out who.
first they had to clean the data: three yearly files, shaped like real erp extracts. the nastiest problem raised no error. one supplier wrote dates day first, and 274 of them converted to the wrong date without a word. a received date can't come before the order date. that one rule caught them.
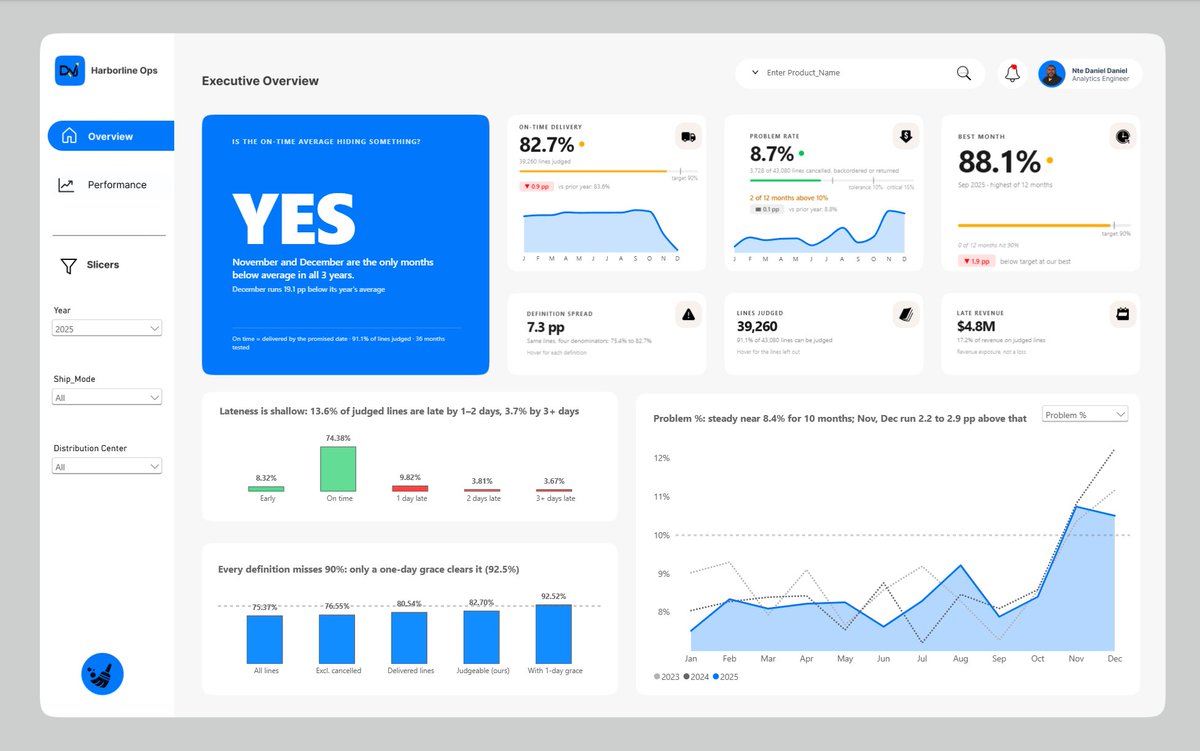
then the average. by year, on-time was 84.0%, 83.6% and 82.7%. nothing to see. by month, january to october ran at 86.7%, november at 73.1% and december at 64.3%, every year.
transit stayed at 2.5 days. warehouse dispatch went from 1.38 days to 1.84. the delay was never on the road.
fixing the warehouse in peak season is worth three times more than fixing the two failing carrier lanes.
𝙩𝙝𝙚 𝙨𝙩𝙤𝙧𝙚𝙨 𝙬𝙚𝙧𝙚𝙣'𝙩 𝙬𝙧𝙤𝙣𝙜, 𝙖𝙣𝙙 𝙣𝙚𝙞𝙩𝙝𝙚𝙧 𝙬𝙖𝙨 𝙩𝙝𝙚 𝙖𝙫𝙚𝙧𝙖𝙜𝙚. 𝙩𝙝𝙚 𝙖𝙫𝙚𝙧𝙖𝙜𝙚 𝙟𝙪𝙨𝙩 𝙘𝙤𝙪𝙡𝙙𝙣'𝙩 𝙨𝙚𝙚 𝙣𝙤𝙫𝙚𝙢𝙗𝙚𝙧.
we built it with ai, on dummy data, on purpose. the ai read the model's structure, wrote and tested the measures, and checked results with read-only queries. it never touched a real company's data, because there wasn't one.
then we did what you would do for a client, with a second dummy dataset standing in. we repointed one folder path and refreshed. on-time moved from 70.4% to 83.4%, every title and alert rewrote itself, and a dataset with nothing to find became the story above. for a real client the rule is the same, with one addition: close the ai connection before their data goes in.
every title on the dashboard states a finding and rewrites itself when the data changes. open it and click around:
https://t.co/HMPft8Eca1
𝙬𝙖𝙣𝙩 𝙩𝙤 𝙡𝙚𝙖𝙧𝙣 𝙩𝙤 𝙗𝙪𝙞𝙡𝙙 𝙩𝙝𝙞𝙨?
new to data? ai-powered data analytics starts 5 december. ₦89,999 / $89.99. practical projects like this one.
register: https://t.co/nJ8pDJEJVM
already write sql and python? analytics engineering starts friday 20 november. ₦150,000 / $150. you build the pipeline that feeds a dashboard like this.
register: https://t.co/kFln0SjC1U
#Datafam #Powerbi
8 Laws of Harvest - Apostle Michael Orokpo, PhD.
(Full Message Title: Laws of Harvest)
For the full sermon, download The Encounter Jesus App on Google Play Store
We’re about to kick off our Python series as we gradually wrap up Cohort 9.
But before then, we’re working on one more Power BI project.
The data model is ready. The dashboard wireframes are done. Now it’s time to bring everything to life.
𝗠𝗼𝗱𝗲𝗹𝗹𝗶𝗻𝗴 𝗮𝗻𝗱 𝘄𝗶𝗿𝗲𝗳𝗿𝗮𝗺𝗶𝗻𝗴 𝗰𝗼𝗺𝗽𝗹𝗲𝘁𝗲𝗱. 𝗙𝗶𝗻𝗮𝗹 𝗿𝗲𝘀𝘂𝗹𝘁𝘀 𝗰𝗼𝗺𝗶𝗻𝗴 𝘀𝗼𝗼𝗻.
And if you’ve been following what we’re building at Data With Danny, registrations for Cohort 10 are currently open.
Whether you’re starting with Data Analytics or advancing into Analytics Engineering, there’s a programme for you.
Send me a DM if you’re interested.
#Datafam
𝙬𝙝𝙖𝙩 𝙘𝙖𝙣 𝙮𝙤𝙪 𝙖𝙘𝙩𝙪𝙖𝙡𝙡𝙮 𝙗𝙪𝙞𝙡𝙙 𝙖𝙛𝙩𝙚𝙧 𝙖 ��𝙚𝙬 𝙢𝙤𝙣𝙩𝙝𝙨 𝙤𝙛 𝙡𝙚𝙖𝙧𝙣𝙞𝙣𝙜 𝙙𝙖𝙩𝙖?
not another certificate or another list of tools on your cv. something you can open, explain and defend.
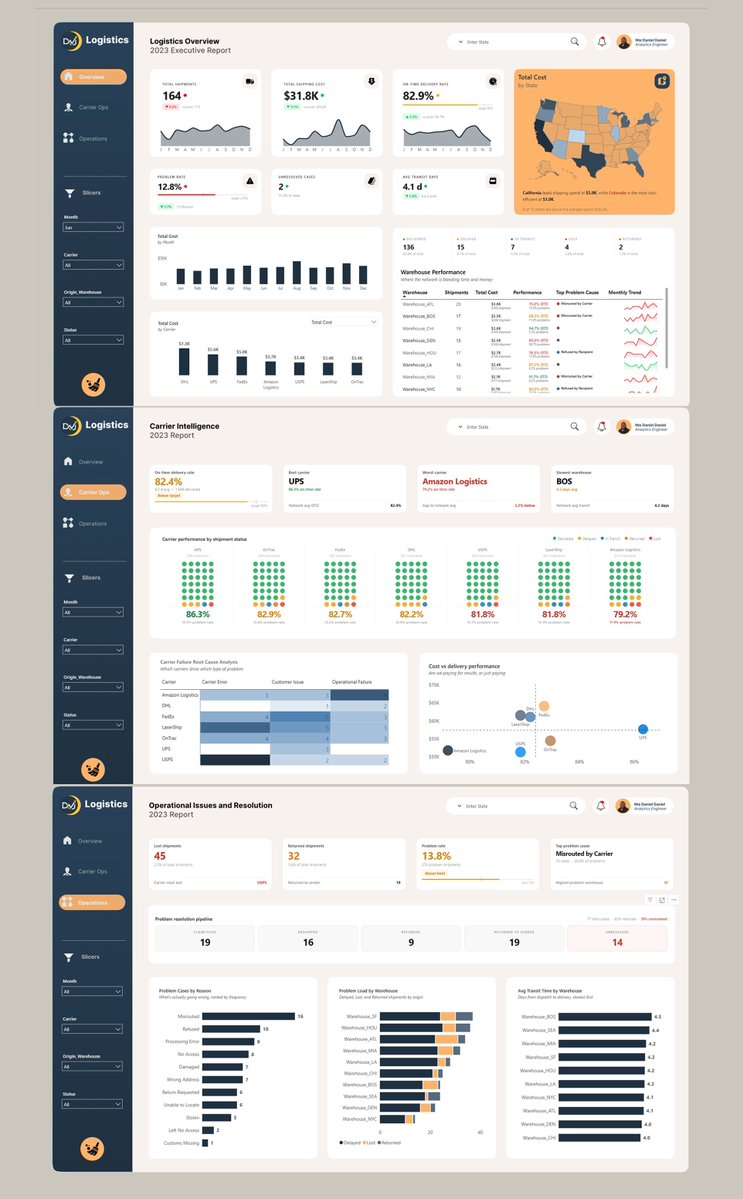
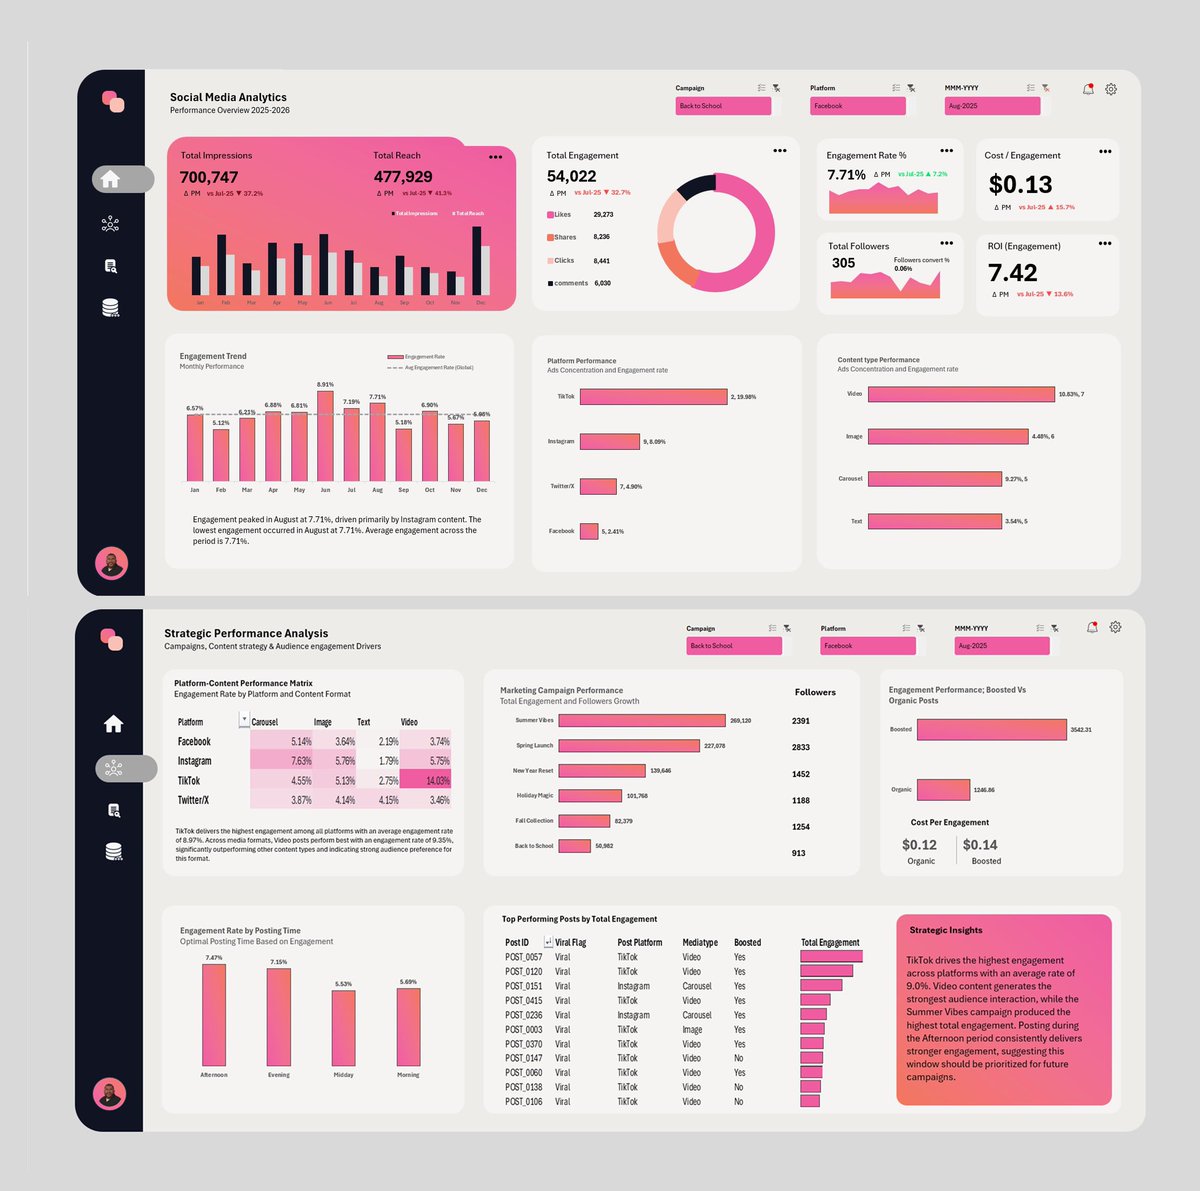
first image: a logistics analytics dashboard built by one of our students in a previous programme.
three pages. shipment performance, carrier operations, delivery costs, warehouse performance, operational issues.
what matters is the thinking behind it. why do some carriers perform better than others? where do shipments get delayed or lost? what should management investigate first?
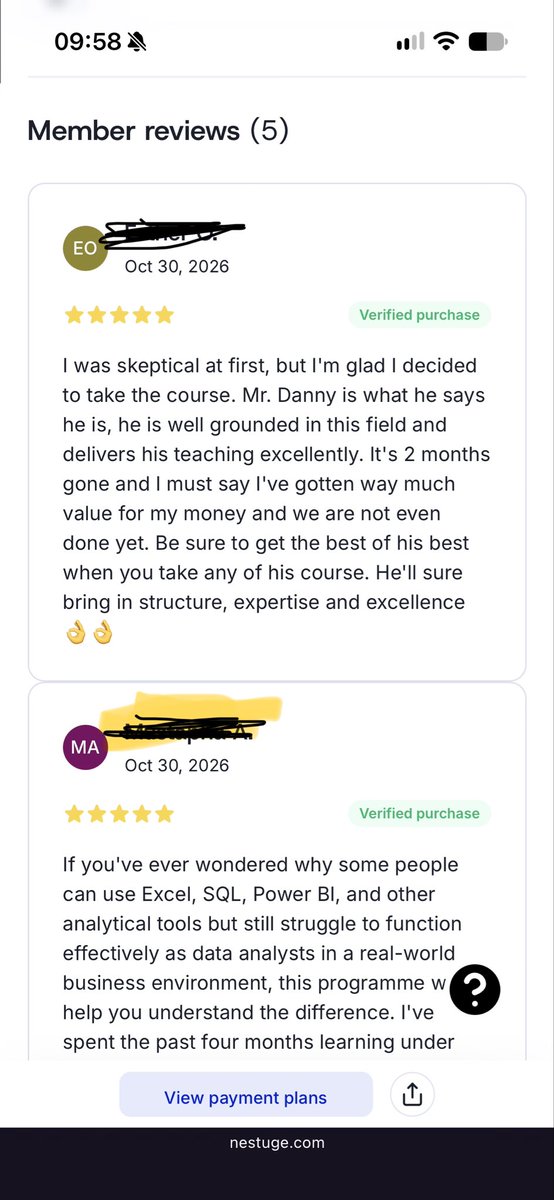
second image: reviews from people who've been through our training.
one student was sceptical before enrolling. two months in, she said she'd already had her money's worth, and the training wasn't over.
another made the point i keep repeating:
𝙠𝙣𝙤𝙬𝙞𝙣𝙜 𝙚𝙭𝙘𝙚𝙡, 𝙨𝙦𝙡 𝙤𝙧 𝙥𝙤𝙬𝙚𝙧 𝙗𝙞 𝙙𝙤𝙚𝙨𝙣'𝙩 𝙖𝙪𝙩𝙤𝙢𝙖𝙩𝙞𝙘𝙖𝙡𝙡𝙮 𝙢𝙚𝙖𝙣 𝙮𝙤𝙪 𝙘𝙖𝙣 𝙬𝙤𝙧𝙠 𝙖𝙨 𝙖 𝙙𝙖𝙩𝙖 𝙖𝙣𝙖𝙡𝙮𝙨𝙩 𝙞𝙣 𝙖 𝙧𝙚𝙖𝙡 𝙗𝙪𝙨𝙞𝙣𝙚𝙨𝙨.
you have to understand the problem, ask better questions, validate your results and explain what the numbers mean.
after 8 cohorts and 500+ graduates, cohort 10 opens with two programmes.
ai-powered data analytics, if you're new to data.
starts 5 december 2026. 4 months. ₦89,999 / $89.99
register: https://t.co/nJ8pDJEc6e
analytics engineering, if you already know sql and python.
databricks, delta lake, dbt, github actions and power bi, with an end-to-end project.
starts 20 november 2026. 22 weeks, 66 live sessions. ₦150,000 / $150
admission includes a technical assessment, so register before 20 november.
register: https://t.co/kFln0Sj4cm
i want you to be able to explain your work and defend your decisions. that's the standard.
𝙘𝙤𝙝𝙤𝙧𝙩 𝟭𝟬 𝙧𝙚𝙜𝙞𝙨𝙩𝙧𝙖𝙩𝙞𝙤𝙣 ��𝙨 𝙤𝙥𝙚𝙣.
not sure where to start? dm me and i'll help you choose.
#Datafam
Where You're Standing Matters - Apostle Michael Orokpo, PhD.
(Full Message Title: Capacity Building)
For the full sermon, download The Encounter Jesus App on Google Play Store
The Power of Wealth and Resources - Apostle Michael Orokpo, PhD.
(Full Message Title: Capacity Building)
For the full sermon, download The Encounter Jesus App on Google Play Store
@iam_daniiell Your Excel function(s) knowledge is transferable when it comes to writing DAX in Power BI.
As you can see every function in the DAX can be found in Excel.
For the Format it's Text in Excel while Quarter is coded like this: ="Q"&ROUNDUP(MONTH(A2)/3,0) in Excel.
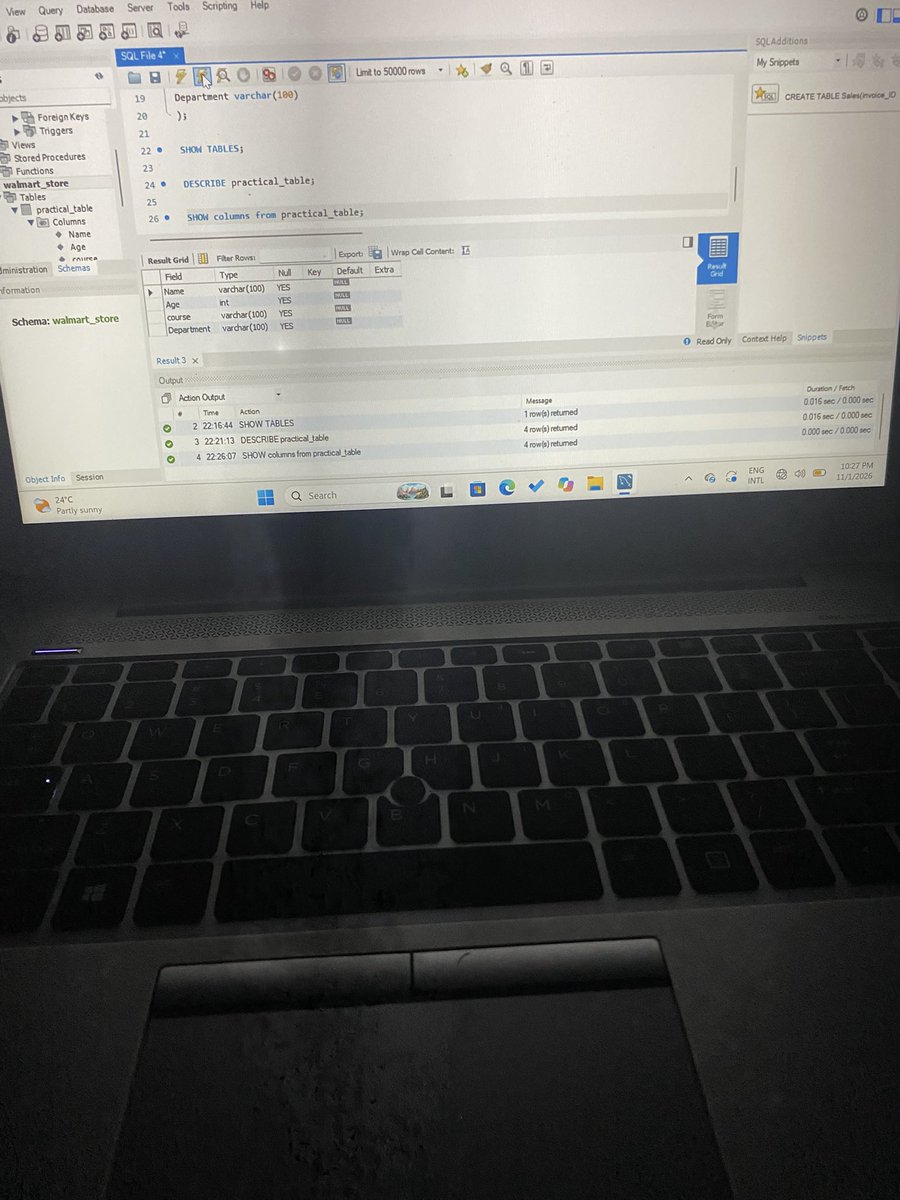
Day 3 of Learning SQL💻
Today, I learnt how to create tables in MySQL and understand their structures.
Here’s what I covered:
- What tables are and how they organise data.
- How to use CREATE TABLE.
- Understanding SQL data types: INT, VARCHAR, CHAR, DATE, DECIMAL and FLOAT.
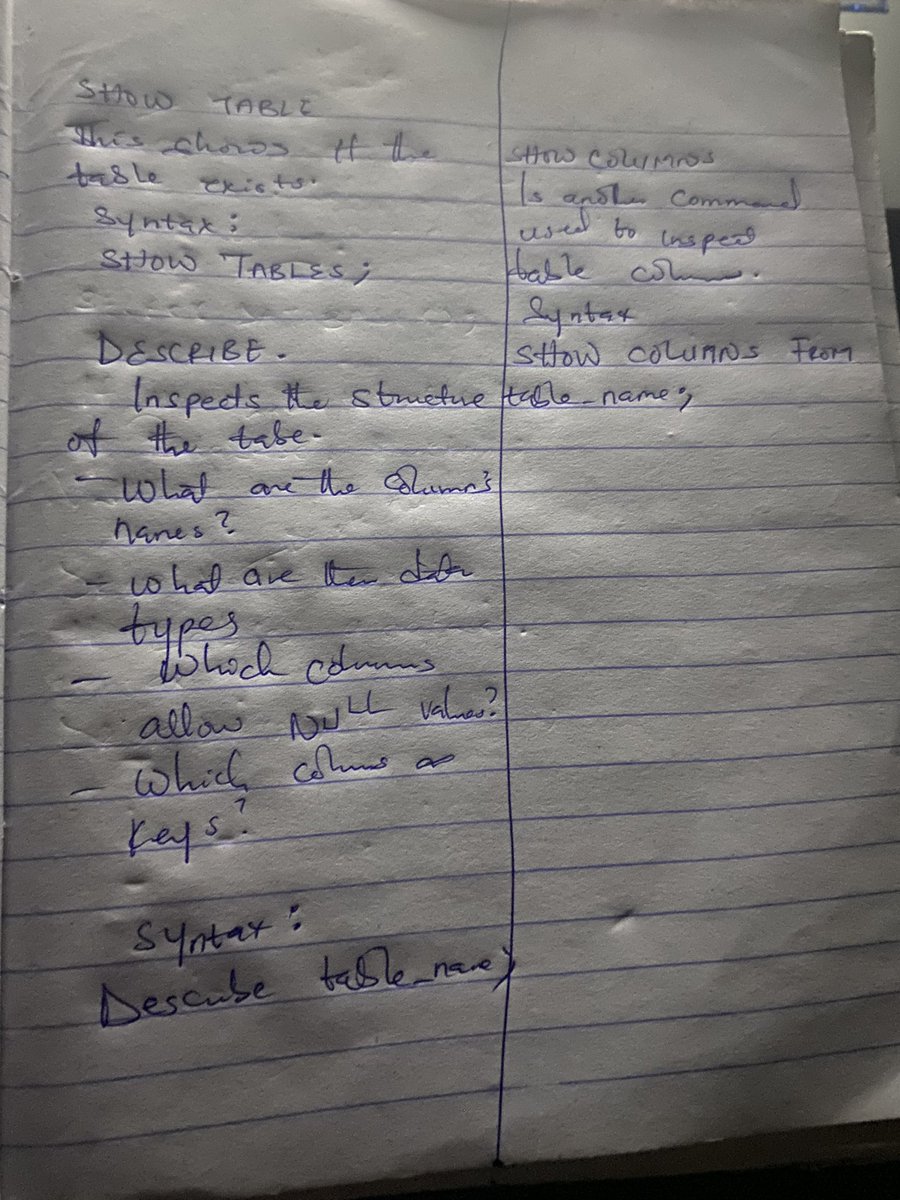
- How to use SHOW TABLES to view tables.
- How to use DESCRIBE to inspect table structures.
- How to use SHOW COLUMNS to view table columns.
I also learnt that a database can contain multiple tables
#30DaysOfSQL #LearningSQL #DataAnalytics