A Complete Guide to ICT's Opening Ranges💡
I Spent Months Studying ICT's Opening Ranges. Here's Everything I Learned.
20+ Pages | Master 5 Different Opening Ranges.
A Thread 🧵
@Manage2Damage I have the same problem. Yesterday ,for example, I was right about the bias and narrative, yet I lost money. Its tiredsome. But when you look at social media, you would never see a loser. Everyone is a winner. Always.
This information is worth thousands of dollars, and you’re getting it free.‼️
☥
ICT explains how to recover from a drawdown!
☥
Listen 👂 Bookmark & Retweet
Master the 2 Types of Turtle Soup with ICT. 🐢🎯
Pen. Notebook. Full focus.
In this lesson you’ll learn:
✅ The difference between both Turtle Soup models
✅ When they actually work
✅ How liquidity confirms the setup
✅ High-probability entry & execution
Most traders know the name.
Very few know how to trade it.
Study this carefully. It could change the way you read the market.
🧵👇
Model 6 & 7 is the ICT universal Model that' works on every Time Frame !!!
The Accuracy is on a different level entirely
You need to see this to the end.
Retweet it..
Bookmark it
If I charged $5,000 for this ICT model, it would still be cheap. Instead, I'm giving it away for free. Master it before 2026 ends and watch what happens to your results.
Retweet it. Bookmark it
In just 37 seconds, ICT breaks down
▪️2022 Model
▪️Silver Bullet
▪️Market Maker Sell Model (MMSM)
▪️Market Structure Shift (MSS)
A lot of valuable insight packed into a short clip.
Like, Follow & Bookmark for your reference!
a quant at a prop firm showed me a 5x5 grid on a napkin
said:
> this is our entire edge. we don't predict price. we predict which box the market is in and where that box historically leads
i didn't understand it for weeks. then it clicked
never looked at a chart the same way since
grid is called a Markov Chain transition matrix. the math is from 1906, it's in every probability textbook on earth
and hedge funds use it because it asks a completely different question than retail traders ever ask
retail: will this go up or down
quant: what state is this market in, and where does this state typically go
every market lives in one of maybe 5-6 states at any given moment
tight range, volatility compression, trending with momentum, post-spike reversal, pre-breakout coil
not random labels - clusters you identify from actual data using volatility, volume, and momentum readings stacked together
once you have the states, you build the matrix:
P(state 2 -> state 4) = 73%
P(state 4 -> state 1) = 61%
P(state 1 -> state 3) = 68%
each cell is a historical probability. now when the market is in state 2, you're not guessing
you're betting on 73% historical completion. you size it with Kelly. you take the trade when the math says to, not when it feels right
i built this on BTC using 2 years of 4-hour data. identified 5 states
one i labeled "volatility compression below 20-day mean for 6+ consecutive candles" transitioned to a directional move above 1.8 ATR in 71% of cases
average reward/risk on those trades: 5.4
that's not prediction. that's reading a probability table the market keeps filling in for you every single day
the part that should bother you: the data to build this is free. the framework is in any quant textbook
python to implement it is maybe 200 lines
what Renaissance Technologies has that you don't isn't secret data or proprietary signals
it's this framework applied to higher-resolution data with more sophisticated state definitions
you're not missing information
you're asking the wrong question every single time you open a chart
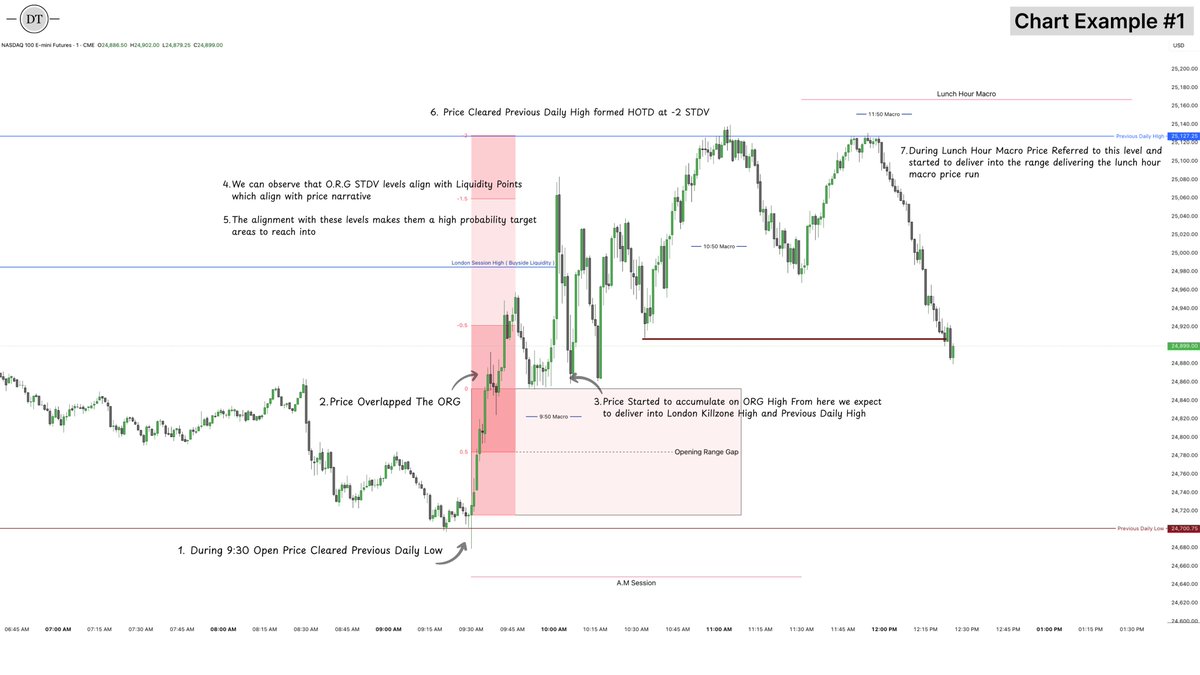
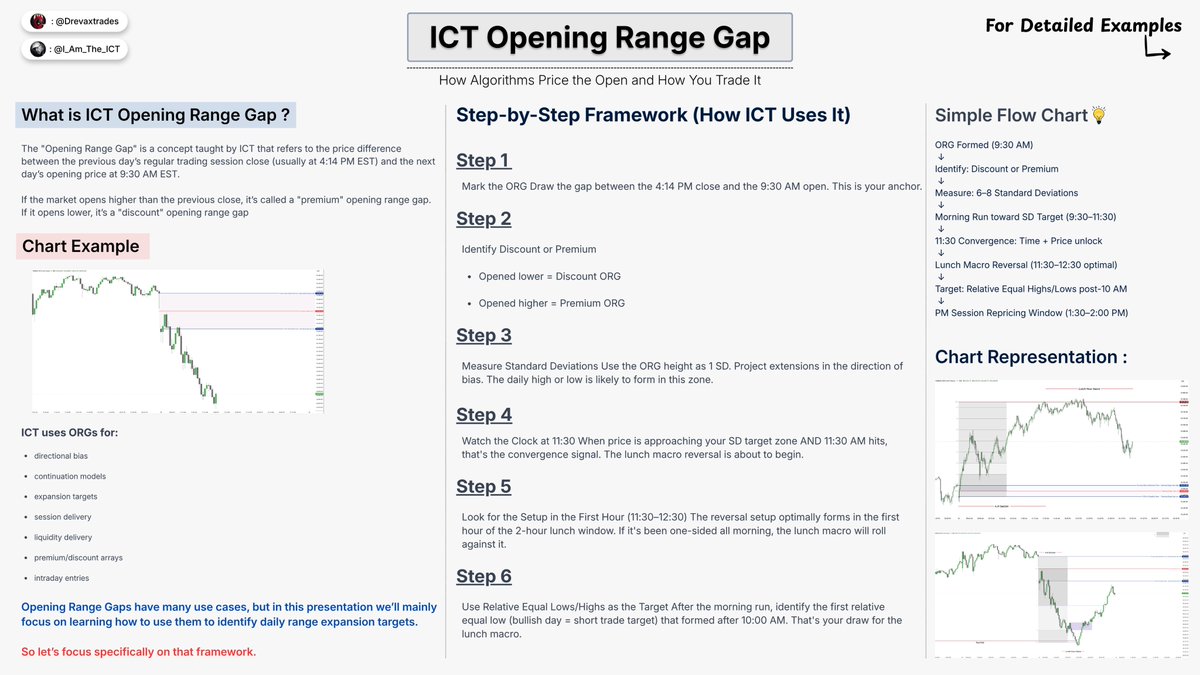
The ICT Opening Range Gap (ORG) Framework 💡
One Of The Most Powerful Time-Based Model:
For Understanding 9:30 Open Delivery, Liquidity Expansion, Standard Deviation Targets, And Lunch Hour Reversals.