Vàng có thể giảm giá hết năm nay
Capital Economics dự kiến vàng sẽ giảm trong thời gian còn lại của năm, khi Fed tiếp tục tăng lãi suất. Các chuyên gia cho rằng điều này có thể gây áp lực lên giá kim loại quý.
🔥 TECHNICAL ANALYSIS & TRADING PLAN: HYPURR
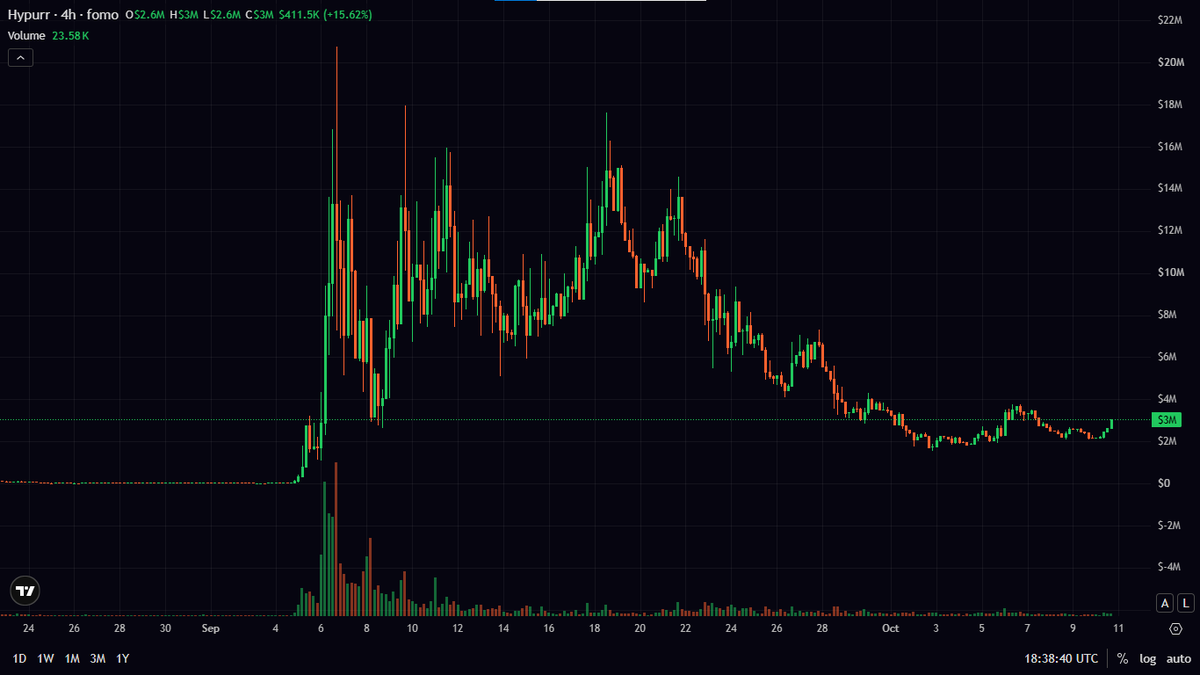
Overview & Market Cap Parameters
Current Market Cap: ~$3.0M
Valuation Assessment: Sits in the Low-Cap range ($2M - $5M). Represents a classic emerging meme token that completed its initial shakeout cycle.
Price Discount: Previously reached a peak of $17M - $21M MC in mid-September. Price has heavily discounted by ~85% down to the current $2M - $3M accumulation range.
Price Action & Volume Analysis
Shakeout & Bottoming Phase:
After selling off from its $17M+ peak, the downtrend halted completely upon testing the $1.8M - $2.0M support floor in early October.
Accumulation Base Pattern:
Range Low Consolidation: Price is coiling horizontally within a tight $2.0M - $3.5M range.
Extreme Volume Dry-Up: 24h trading volume has plummeted down to 81.71K on 1D and 22.83K on 4H, dropping over 98% from peak levels. This indicates complete seller exhaustion as float supply dries up.
4H Push Candle: Price recently ticked green back to $3.0M, signaling quiet accumulation by early buyers.
Detailed Trading Strategy
Accumulation Entry Zone:
Buy Zone 1: Current price levels around $2.5M - $3.0M MC.
Buy Zone 2 (DCA): $2.0M - $2.2M MC (In case of a final floor sweep).
Breakout Confirmation:
Requires a 4H/1D candle close above $3.8M - $4.0M MC resistance on expanding green volume.
Take Profit Targets:
TP1: $5.5M - $6.0M MC (2x target from bottom base).
TP2: $9.0M - $10.0M MC (Prior major support flip).
TP3: $14.0M - $17.0M+ MC (ATH Retest target).
Risk Management (Stop Loss):
4H/1D candle close below $1.8M MC (Invalidates the bottom accumulation thesis).
📌 Summary: Hypurr displays a prime Low-Cap ($3M) accumulation setup: Deep discount (-85%) -> Horizontal consolidation base -> Complete volume exhaustion. Offers an exceptional Risk/Reward ratio for a 2x-3x rebound wave!
#Hypurr #FOMO #Crypto #Altcoins #TechnicalAnalysis #Trading
Check out this position on fomo https://t.co/svnFP9ZKij
🔥 TECHNICAL ANALYSIS & TRADING PLAN: MARSCOIN
1. Overview & Market Cap Parameters
* Current Market Cap: ~$95.2M
* Valuation Assessment: MarsCoin is currently hovering right around the psychological $100M valuation threshold. Having previously created a massive peak near $260M in early September, it sits in a high-potential mid-cap range with solid structural liquidity for a secondary wave.
2. Price Action & Volume Analysis
* ATH Peak & Correction Cycle:
* On the 1D chart, MarsCoin experienced an explosive rally in early September, surging from $40M - $60M up to an ATH of ~$260M.
* Following the peak, price underwent a natural cool-down, finding strong initial demand around $80M - $90M before attempting a relief rally up to $170M in late September.
* A secondary pullback brought price back down to test the major structural support floor around $85M - $90M.
* Accumulation & Floor Defense Signals:
* Key Support Bounce: The $85M - $90M zone has proven to be a crucial support pivot, generating a clean bounce back to $95.2M.
* Volume Dry-Up: Trading volume on both 1D and 4H charts has significantly dried up (down to ~210K - 490K) compared to the multi-million volume spikes during the pump. This volume contraction indicates that panic selling has exhausted, entering a classic Wyckoff accumulation/consolidation phase.
* 4H Base Building: On the 4H timeframe, price action is rounding out a local higher low base around $90M - $95M.
3. Detailed Trading Strategy
* Accumulation Entry Zone:
* Buy Zone 1: Current market price around $90M - $96M MC
* Buy Zone 2 (DCA): $80M - $85M MC (In case of a final liquidity sweep)
* Breakout Confirmation:
* A 4H/1D candle close above the $120M MC short-term resistance accompanied by expanding green volume will confirm the start of the next expansion phase.
* Take Profit Targets:
* TP1: $135M - $145M MC (4H mid-range resistance)
* TP2: $170M - $180M MC (Previous lower-high peak)
* TP3: $220M - $260M MC (ATH Retest target)
* Risk Management (Stop Loss):
* Daily candle close below $78M MC (Invalidates the support bounce structure).
📌 Summary:
MarsCoin is defending its major $85M - $90M floor with low volume selling pressure. The current risk/reward ratio favors position building for the next leg up towards $140M+.
#MarsCoin #FOMO #Crypto #Altcoins #TechnicalAnalysis #Trading
Check out this position on fomo https://t.co/PD1PM84Mr3
🔥 ALTAI THE TIGER – REBOUND SETUP AFTER INITIAL DIP
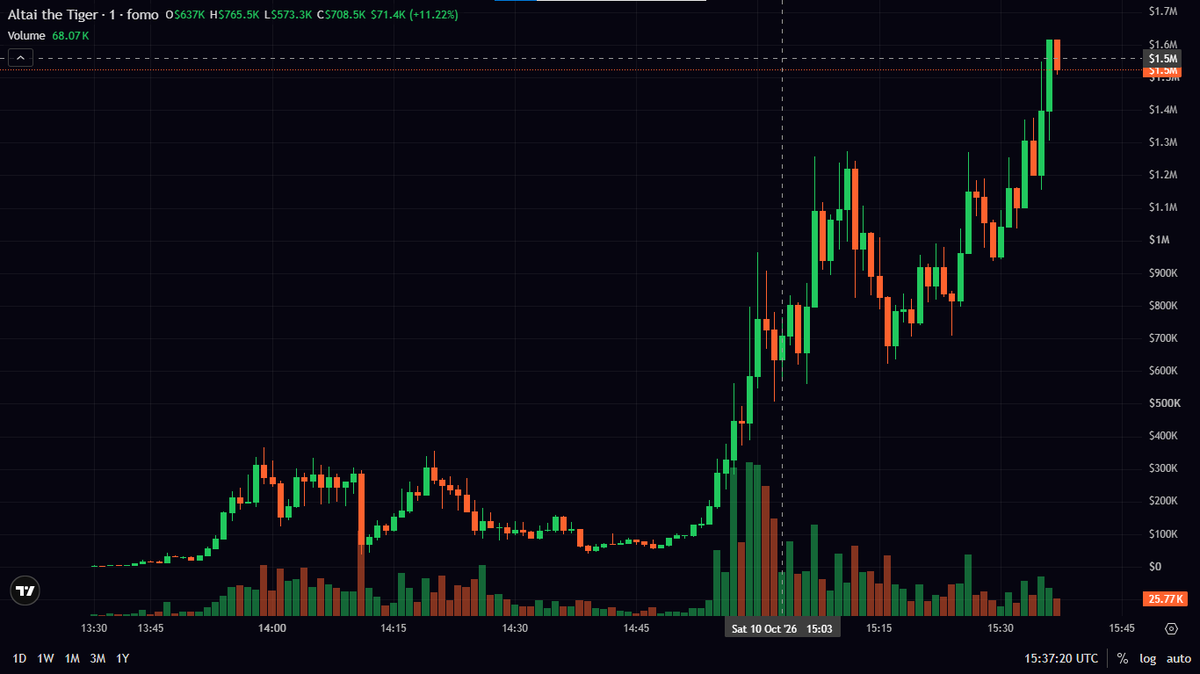
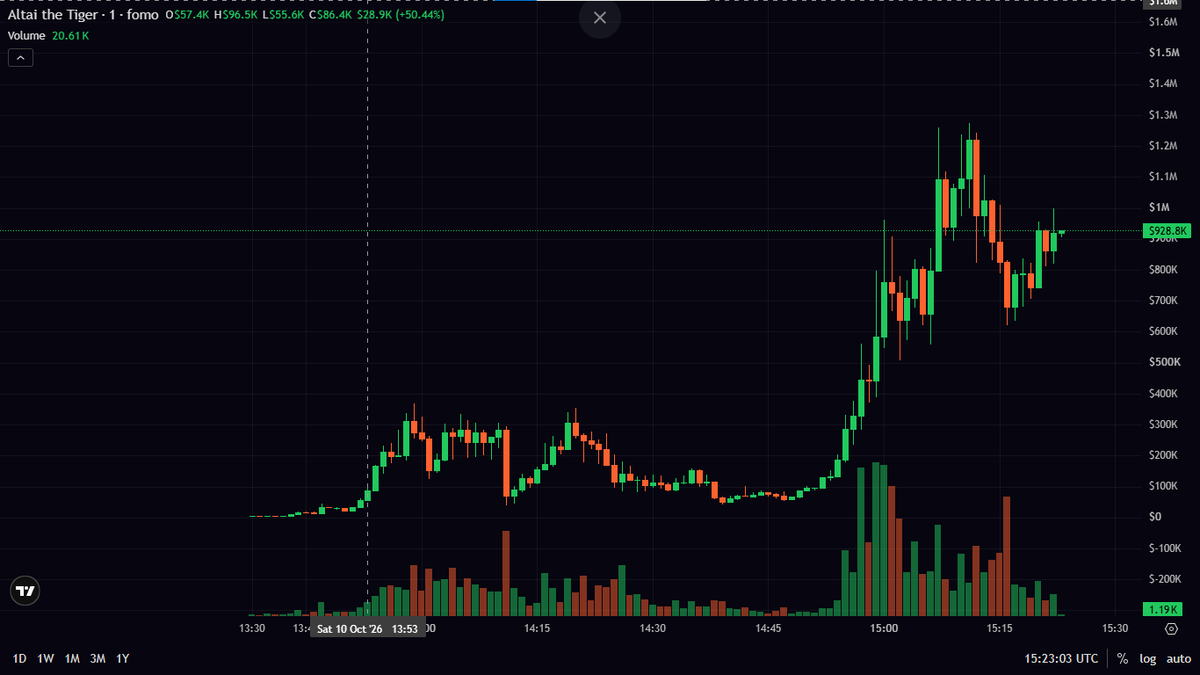
Altai the Tiger is establishing a solid bounce structure after pulling back from its $1.28M local high. Price action has held the $700K support floor and is attempting a momentum recovery.
Technical Highlights:
1M Timeframe: Strong initial pump from $200K up to $1.28M MC backed by massive buying volume.
Healthy Pullback: Profit-taking dropped price down to $700K MC, where strong buyers stepped in to create a sharp bounce back to $857.5K MC.
Volume Status: Selling pressure is weakening as buyers absorb floating supply near key support levels.
Trade Setup (Based on Market Cap):
Entry Zone: $750K - $850K MC
Stop Loss (SL): $650K MC (Break below key bounce support)
Take Profit 1 (TP1): $1.0M MC
Take Profit 2 (TP2): $1.25M - $1.3M MC (ATH Retest)
Take Profit 3 (TP3): $1.8M - $2.0M MC (Extension Target)
📌 Disclaimer: Ultra low-cap meme tokens feature high volatility. Practice strict risk management. NFA!
#AltaiTheTiger #FOMO #Crypto #Altcoins #Trading #TradeSetu
🔥 CYBERLEEK ($fomo) – TRADE SETUP & TARGETS
Quick update on CYBERLEEK ($fomo) after the recent breakout confirmation! Price action is holding strong above key support levels.
Trade Parameters (Based on Market Cap):
Entry Zone: $1.90M - $2.00M MC (Current Entry: $1.96M MC)
Stop Loss (SL): $1.55M MC (Invalidation below key hourly support)
Take Profit 1 (TP1): $3.50M MC
Take Profit 2 (TP2): $5.00M MC
Take Profit 3 (TP3): $8.00M - $10.00M MC (Runner)
Risk Management:
Move SL to breakeven once TP1 is hit.
Always scale out partially at target levels to lock in profits.
📌 Disclaimer: High volatility low-cap token. Practice strict risk management. NFA!
#CyberLeek #FOMO #Crypto #Trading #TradeSetup
🔥 CYBERLEEK ($fomo) – Trend Reversal Signal or Bull-Trap?
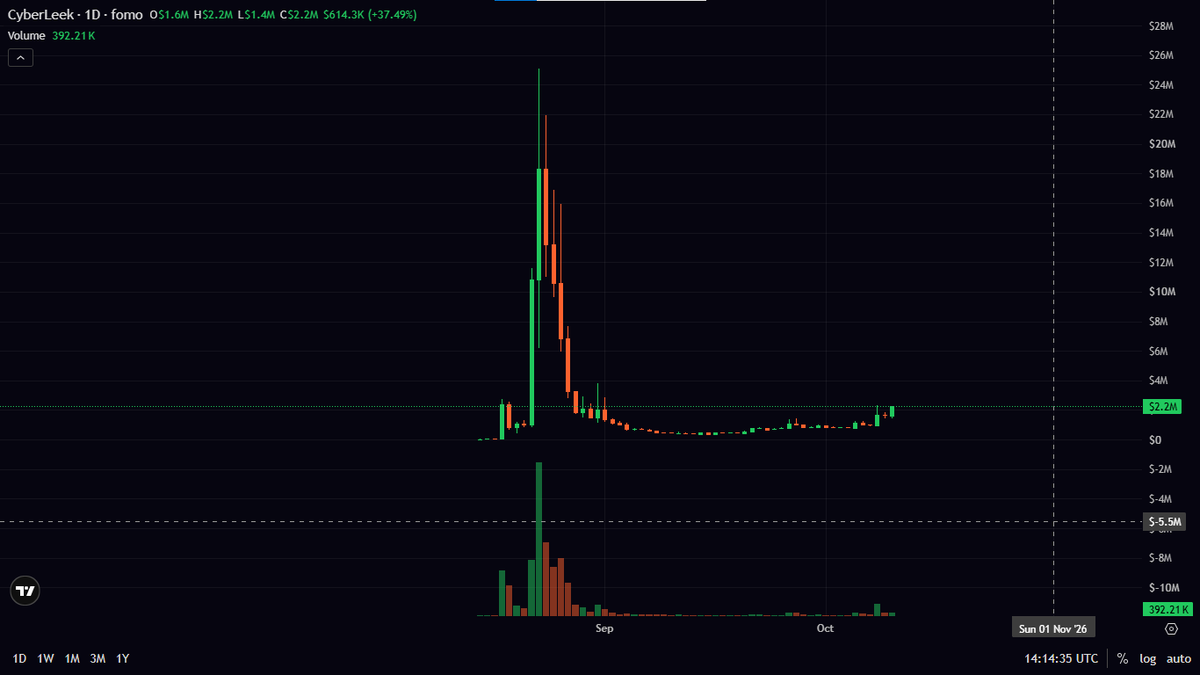
After a heavy dump from its $26M ATH down to the bottom accumulation zone, CyberLeek ($fomo) is showing strong signs of life on the charts! 📈
Technical Highlights:
1D Timeframe: Strong buy pressure has kicked in, pushing Market Cap up +37.49% to reclaim the $2.2M level.
1H Timeframe: Short-term structure has broken out of the $750K – $1M consolidation range with a noticeable increase in buy volume.
Key Resistance: The $3M – $4M zone. Breaking above this level opens up significant room for further upside, though heavy overhead supply from previous bagholders remains higher up.
Key Support: $1.5M – $1.7M (well-tested on the 1H timeframe) and the major floor at $1M.
Trading Strategy:
If you bought the bottom: Move your stop-loss to breakeven/profit and consider scaling out partially near the $3M – $4M resistance.
If you're looking for an entry: Avoid FOMO buying into green candles. Wait for a healthy pullback to test the $1.5M – $1.7M support zone with decreasing volume before entering.
📌 Disclaimer: Low-cap tokens come with extreme volatility. Manage your risk carefully. NFA!
#CyberLeek #FOMO #Crypto #TechnicalAnalysis #Altcoins #Trading
Check out this position on fomo https://t.co/3b6I2V79hJ
🔥 TECHNICAL ANALYSIS & TRADING PLAN: THE BLACK BULL
Overview & Market Cap Parameters
Current Market Cap: ~$136.4M
Token Price: ~$0.136
24H Volume: Dried up around 193K - 460K
Valuation Assessment: Sitting in the Mid-Cap range ($100M - $200M). This is a solid valuation zone for a established meme token that previously hit an ATH of ~$454M and possesses deep liquidity for the next expansion leg.
Price Action & Volume Analysis
Double Top & Correction Structure:
On the 1D timeframe, the token completed two massive rallies: the first hitting peak near ~$450M in July, and the second retesting ~$400M in late August.
Following the second top, price entered a protracted correction phase from September into October, retracing from $400M down to major support around $120M - $130M.
Accumulation Signals on 1D & 4H:
Major Floor Defense: The $120M - $125M MC range has proven to be an extremely reliable support level. Price retested this zone multiple times without breaking down, forming a clear Multiple Bottoms pattern.
Volume Dry-Up: Comparing current volume bars against the peak activity, liquidity has plunged down to 193K - 460K levels. This volume exhaustion is a classic Wyckoff Accumulation Phase characteristic: selling pressure has effectively vanished, leaving the chart tightly compressed and waiting for catalyst volume.
Range Tightening: On the 4H chart, price is coiling within a tight consolidation range between $130M and $175M.
Detailed Trading Strategy
Accumulation Entry Zone:
Buy Zone 1: Current price levels around $130M - $136M MC (sitting right at major support).
Buy Zone 2 (DCA): If a liquidity sweep/shakeout occurs down toward $120M MC.
Breakout Confirmation:
Requires a 4H/1D candle close above the $175M - $180M MC resistance on expanding green volume to confirm the start of the next Markup phase.
Take Profit Targets:
TP1: $180M - $200M MC (Short-term 4H resistance).
TP2: $250M - $275M MC (Mid-term resistance level).
TP3: $350M - $400M+ MC (Previous ATH retest).
Risk Management (Stop Loss):
Daily close below $115M MC (Invalidates the accumulation thesis as market structure breaks).
📌 Summary: The Black Bull is resting in a prime accumulation zone near its major $120M - $135M floor with completely dried-up volume. For position traders looking to capture the next wave, this zone offers an exceptionally favorable Risk/Reward ratio!
#TheBlackBull #FOMO #Crypto #Altcoins #TechnicalAnalysis #TradingStrategy
https://t.co/AREGCpggWw
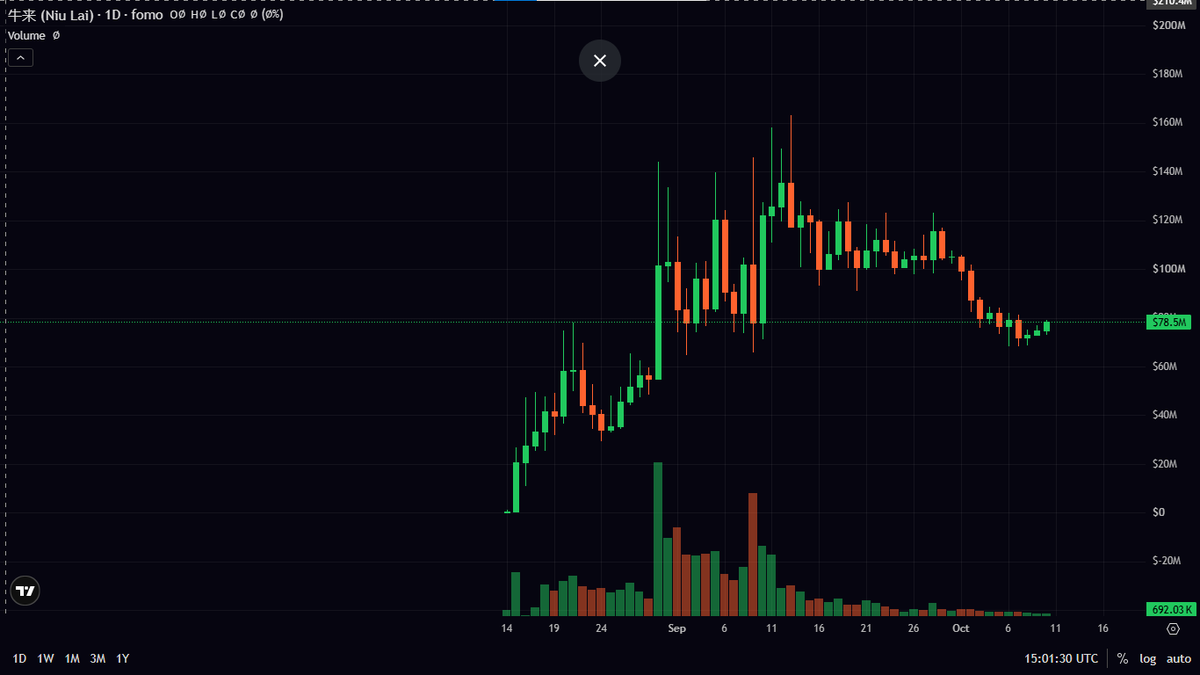
🔥 NIU LAI (牛来) – BOTTOM ACCUMULATION & REBOUND SETUP
Niu Lai (牛来) has completed a healthy pullback from its $160M+ ATH and is now showing clear signs of bottom formation around the $70M MC support floor.
Technical Highlights:
1D Timeframe: Price tested the key $65M - $70M support zone and bounced with renewed buy volume.
Buy pressure is reclaiming dominance (154 buys / $114.8K buy vol vs 113 sells) as price recovers back to $78.6M MC.
Risk/Reward ratio looks highly favorable for a position play at this structural support level.
Trade Setup (Based on Market Cap):
Entry Zone: $70.0M - $78.6M MC
Stop Loss (SL): $62.0M MC (Break below key support floor)
Take Profit 1 (TP1): $100.0M MC
Take Profit 2 (TP2): $130.0M MC
Take Profit 3 (TP3): $160.0M - $180.0M MC (ATH Retest)
📌 Disclaimer: Practice proper risk management. NFA!
#NiuLai #FOMO #Crypto #Altcoins #Trading #TradeSetup
Check out this position on fomo https://t.co/SZuvwl2pXW
🔥 TELEMONEY ($TM) – Explosive Debut & Current Price Structure
TeleMoney ($TM) recently launched on Solana and triggered a massive initial surge. Here is a breakdown of what drove the rally and where the price stands right now.
Why It Exploded:
Strong Narrative: Riding the hype of Telegram ecosystem integration and Web3 payment utility, making it an instant magnet for low-cap crypto traders.
Bot Driven Liquidity: Heavy buying from sniper bots and automated tools pushed volume up to $1.8M - $2M within the first few hours, creating huge FOMO.
Viral Social Hype: Rapid sharing across X and Telegram alpha groups fueled aggressive retail buying into the initial breakout.
Current Price Situation:
Market Cap Status: After the initial spike, Market Cap is currently cooling down and consolidating around the $600K – $1.1M range.
Profit-Taking Pressure: Early buyers and sniper bots have been dumping holdings, causing sell volume to temporarily outweigh buy volume.
Finding a Floor: The price has entered a standard cool-down phase, searching for a solid support zone to establish a new base.
Strategy & Risk Note:
Avoid chasing green candles during heavy volatility. Wait for the chart to form a clear accumulation base before considering an entry.
High risk low-cap token. Always verify contract safety and manage your risk carefully. NFA!
#TeleMoney #TM #Solana #Crypto #Trading #MemeCoin
Check out this position on fomo https://t.co/XRUS0vPSOJ
🔥 CYBERLEEK ($fomo) – Trend Reversal Signal or Bull-Trap?
After a heavy dump from its $26M ATH down to the bottom accumulation zone, CyberLeek ($fomo) is showing strong signs of life on the charts! 📈
Technical Highlights:
1D Timeframe: Strong buy pressure has kicked in, pushing Market Cap up +37.49% to reclaim the $2.2M level.
1H Timeframe: Short-term structure has broken out of the $750K – $1M consolidation range with a noticeable increase in buy volume.
Key Resistance: The $3M – $4M zone. Breaking above this level opens up significant room for further upside, though heavy overhead supply from previous bagholders remains higher up.
Key Support: $1.5M – $1.7M (well-tested on the 1H timeframe) and the major floor at $1M.
Trading Strategy:
If you bought the bottom: Move your stop-loss to breakeven/profit and consider scaling out partially near the $3M – $4M resistance.
If you're looking for an entry: Avoid FOMO buying into green candles. Wait for a healthy pullback to test the $1.5M – $1.7M support zone with decreasing volume before entering.
📌 Disclaimer: Low-cap tokens come with extreme volatility. Manage your risk carefully. NFA!
#CyberLeek #FOMO #Crypto #TechnicalAnalysis #Altcoins #Trading
Check out this position on fomo https://t.co/3b6I2V79hJ