@Peteey5 Love it, man. I’ve been thinking about it for a while and finally am in the process of starting my bookkeeping company. Would love to chat sometime
24/ Opensea is the biggest player in the NFT marketplace industry and we expect them to remain strong if they can continue making the user experience simple for new users.
Thanks to the covalent team!
And if you made it this far in this longgggg thread, thank you! /END
16/ In January of this year, fee revenue was over $100M per month and by October and November this year, it's around $5M. The entire NFT market took a huge hit so this is not exclusive to Opensea. You can see a similar drop in sales revenue.
23/ Another driver is the NFT collections exclusive to the platform. Having exciting collections launching on Opensea will continue to be a huge aspect of new user adoption.
15/ Now we can look at revenue metrics. Opensea has strong reach and retention, but how are they monetizing? We'll look at fee rev and sales and growth rate on a monthly basis. Fee revenue (based on volume + 2.5% fee) declines sharply this year, reflecting the market challenges
1/ I am learning on-chain data analysis as part of @Covalent_HQ Data Alchemist course. This week I'll explore the NFT marketplace Opensea. We will look specifically at reach, retention, and revenue metrics to better understand Opensea's market position.
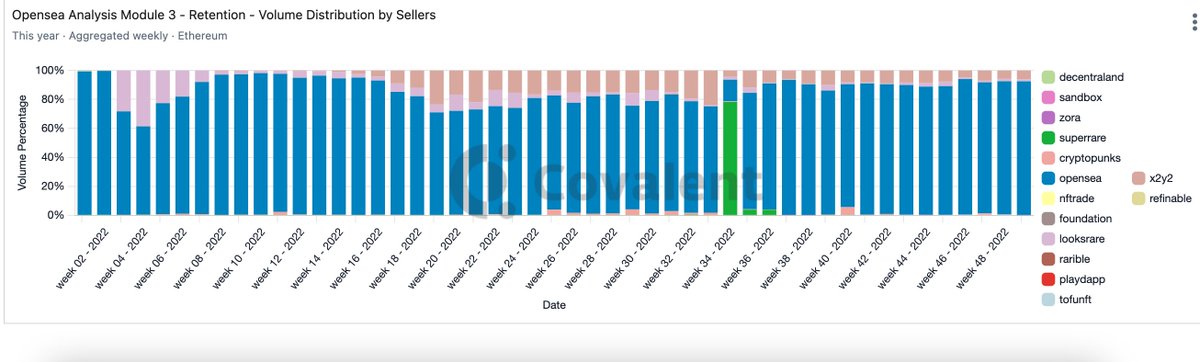
14/ For seller distributions, we can see similar trends to the buyer charts. X2Y2 and Looksrare emerge in mid-2022 but don't take too much seller volume. For many weeks in Q3, Opensea has over 80% of the volume from its previous sellers.
13/ Let's start with buyer volume distribution. We've aggregated the data by week and are looking only at 2022. We can see the different marketplaces that Opensea buyers interacted with. We can see the emergence of X2Y2 and Looksrare, but Opensea overall maintains buyers well.
12/ Another retention metric is Volume distribution for buyers and sellers. This looks at wallets that have interacted with Opensea and then see where their selling or buying volume is distributed across NFT platforms. You can think of this as marketplace loyalty
11/ When we look at seller retention, we see a bit of a steeper decline than buyer retention. In the first three months of the year, one-month retention ranged from 35-39%, and in the most recent three months, it ranged from 15-22%.
10/ As expected, this number falls in the following months. After two months retention ranges from 15-19%. There's a slight decline in 2 and 3-month retention as the year went on, but not major considering the market decline.
9/ We can see buyer retention in this chart. It finds the first month a wallet purchased an NFT on OS and then looks if they came back the following months. We can see retention numbers falling slightly over time. One month buyer retention ranged from 20-31%
8/ We now want to explore retention. Opensea clearly has a strong reach as the dominant player in the market, but will they be able to maintain this head start? We'll see how well they are retaining buyers and sellers.
7/ These charts show the top collections on Opensea by sales volume over the past year. We can see popular projects like ENS, AI Moonbirds, and Otherdeed. All these charts give us a sense of the reach of Opensea, its users, and trends in sales.