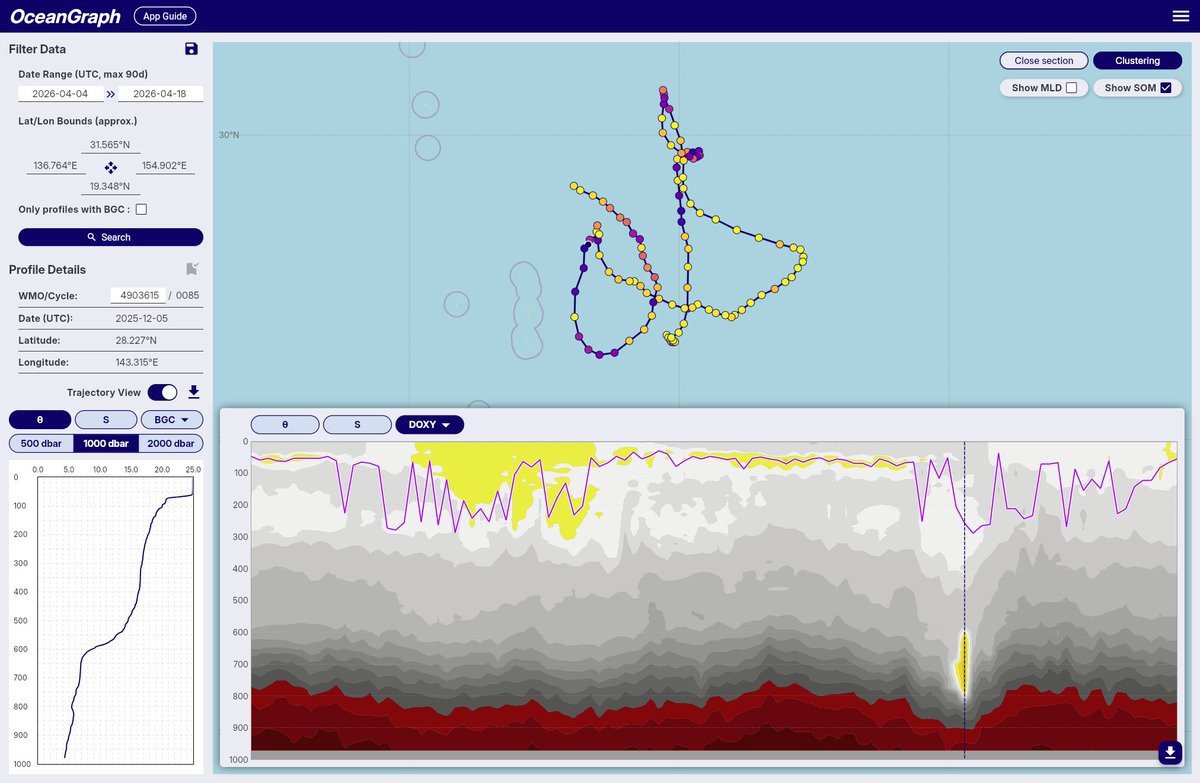
OceanGraph brings Argo float trajectories and the ocean beneath them into one interactive view.
Explore vertical profiles and time-series sections for temperature, salinity, and BGC observations:
https://t.co/GXUzpoXqWb
#ArgoFloat#Oceanography
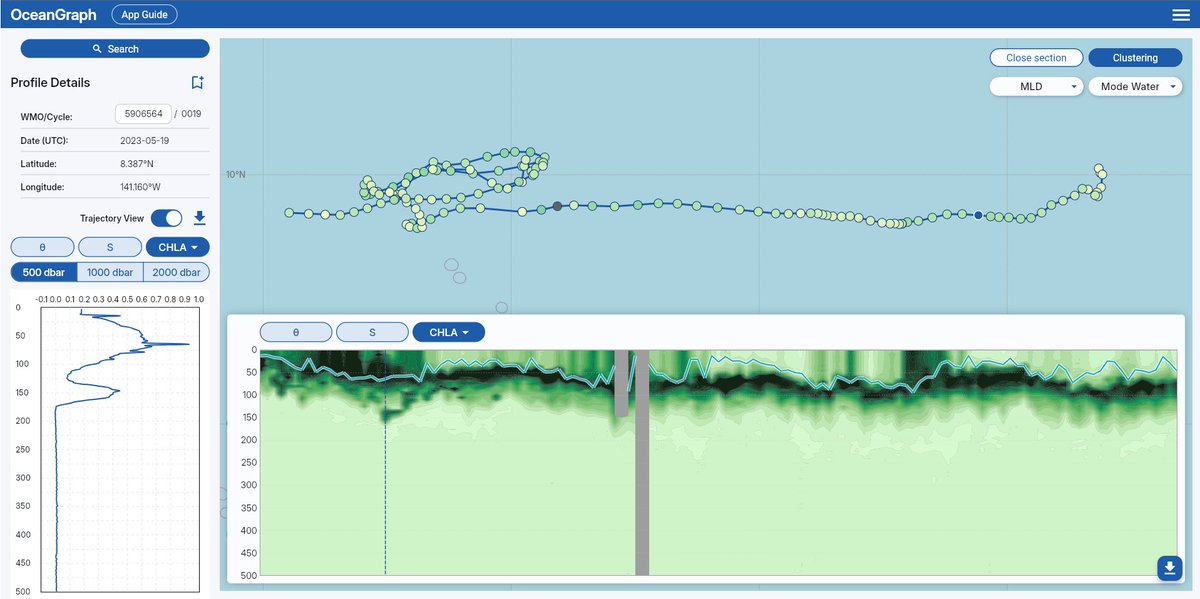
One float. Years of observations. One view from the map down to 2,000 dbar.
@OceanGraphIO brings an #ArgoFloat trajectory together with its temperature profiles and time-series section—so you can explore where it traveled and what it observed below. #Oceanography
How can marine images become AI training data?
Using Label Studio + SAM, we explore an efficient workflow for annotating underwater images—from Docker + NVIDIA GPU setup to SAM-assisted segmentation.
#OceanScience#MachineLearning#SAM
https://t.co/myPeTwGNsW
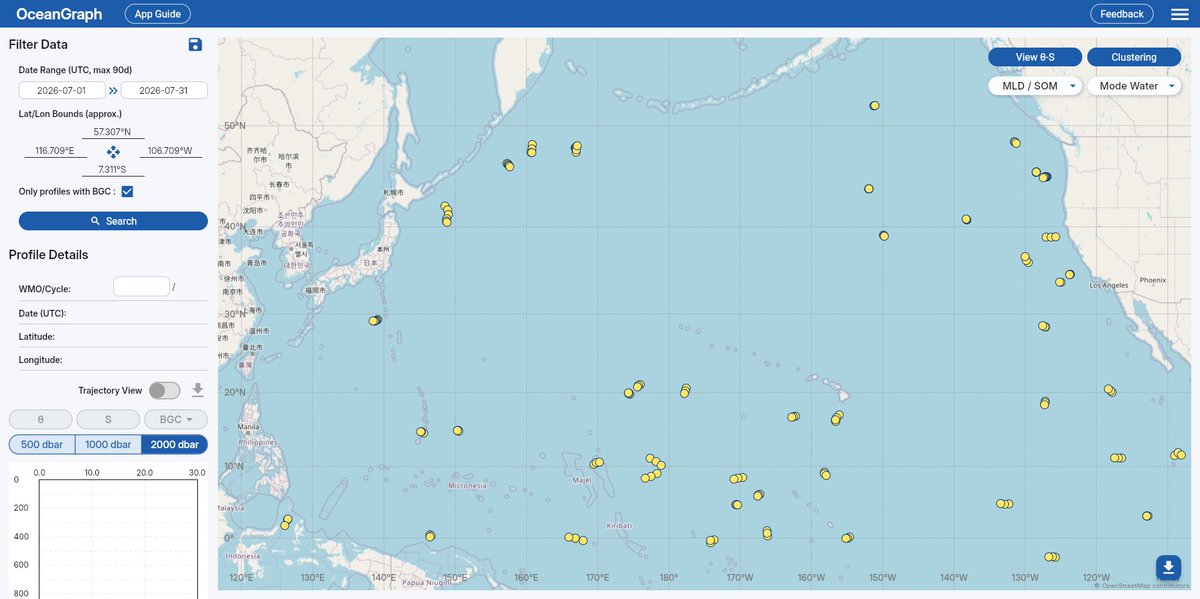
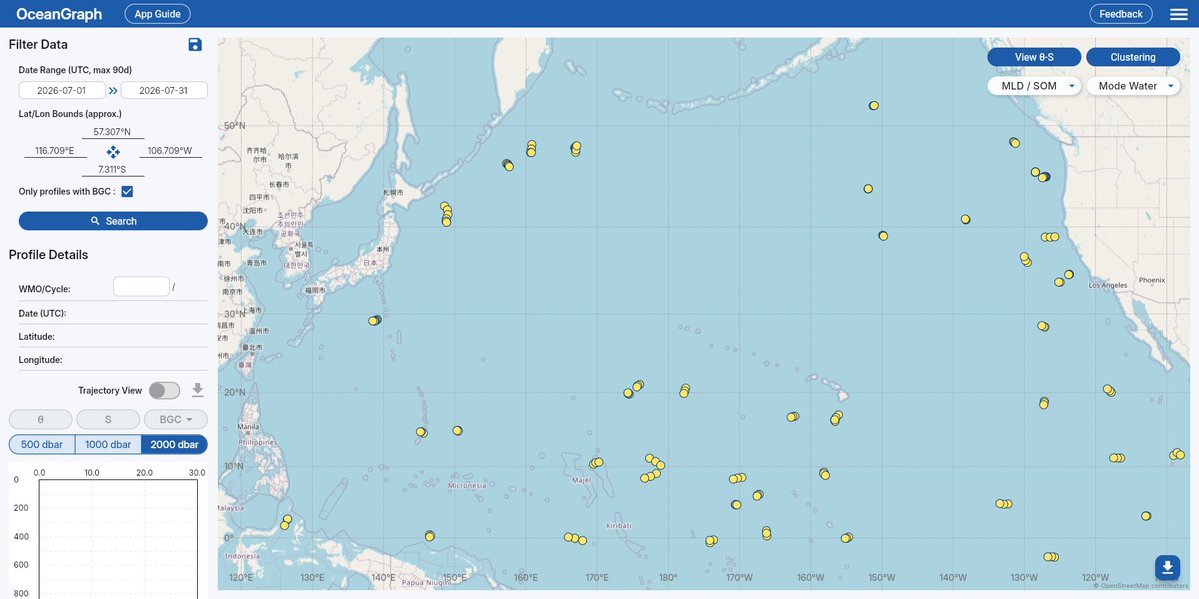
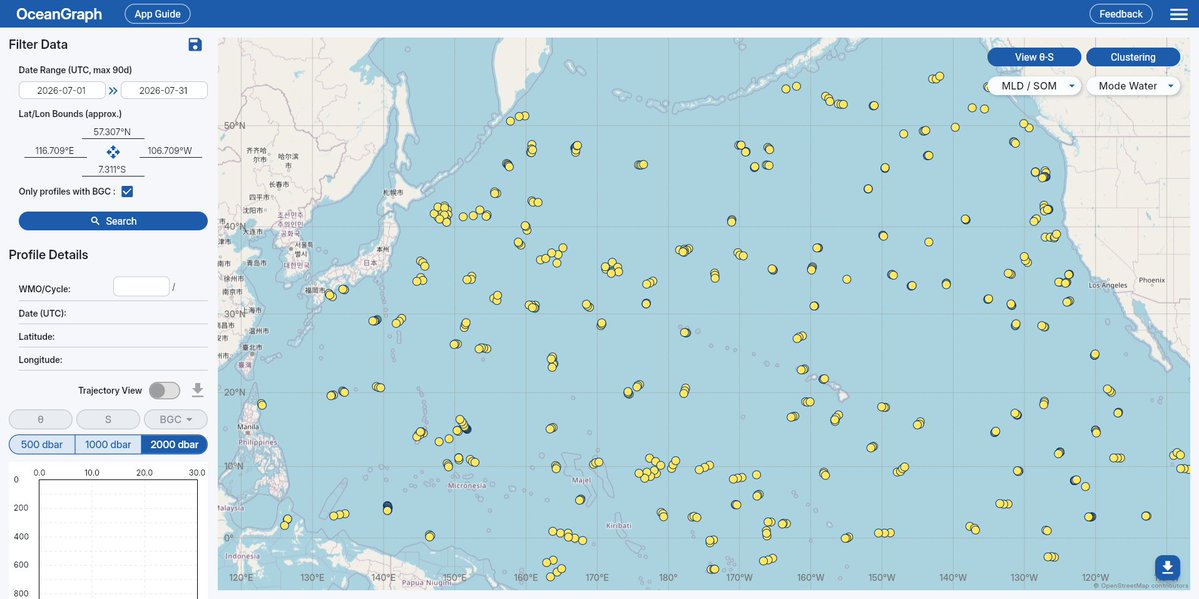
More BGC-Argo data is now available in OceanGraph!
We improved our processing, so many observations that couldn’t previously be included can now be searched and visualized—including dissolved oxygen, nitrate, chlorophyll, pH, and more.
←Before
After→
The ocean isn't one temperature. It changes with depth, with the season, and with whichever current happens to pass through.
Articles on how the ocean works — and on how to read the Argo observations that show it.
https://t.co/gCsm2FSXGD
This week’s OceanGraph data update will be skipped while we work on improvements to help you better explore and use BGC Argo data.
Regular data updates will resume next week.
Thanks for your patience!
A remarkably deep Deep Chlorophyll Maximum (DCM) observed in BGC-Argo data. The chlorophyll maximum is found at around 150 m.
Looking forward to exploring what drives this feature.
https://t.co/xLowTwid5Y
OceanGraph continues to receive weekly data updates.
We’re also continuously shipping improvements and new features—both big and small—to make the platform better every week.
More to come. 🌊
4. You can now switch depth ranges dynamically.
Focus on surface layers or zoom into deeper structures as needed—making your analysis faster, more targeted, and more flexible.
🚀 We’ve rolled out several major feature updates!
Here’s a quick thread to walk you through what’s new—and how it improves your workflow 👇
https://t.co/xLowTwid5Y
3. You can now overlay SOM (Subsurface Oxygen Maximum) on vertical section plots.
This helps you quickly identify oxygen maxima and understand subsurface ventilation and biogeochemical structure in context.
Note: Method will be refined in future updates.
OceanGraph weekly data update is live! 🌊
This week’s datasets are now refreshed and ready to explore.
Let me know if you spot anything interesting!
https://t.co/xLowTwid5Y