Can a high-fat ketogenic diet help kids with autism shine brighter? 🧠✨ A 2018 study suggests it might boost social skills & behavior! Dive into the science (with a side of humor) in our latest blog. 🥑🥓 Curious? Click to read more! 👉 https://t.co/vTrAfUSxgl #KetoForAutism #BrainHealth #AutismSupport
⚠️Trigger warning: “I ate more calories and lost fat” is not a claim that I broke thermodynamics.
It’s a factual statement: one supported by controlled human studies, advancements in understanding of basic science, and a more nuanced perspective on fuel partitioning, thermogenesis, and metabolism overall.
The Calories-in - Calories-out mindset is shallow thinking, not a biological explanation of obesity, and circular logic protected by the mere exposure effect.
It’s an anchor holding back progress.
🔗https://t.co/JSLPT7x2vM
Cc @BenBikmanPhD@drjasonfung@BiggestComeback know 😉
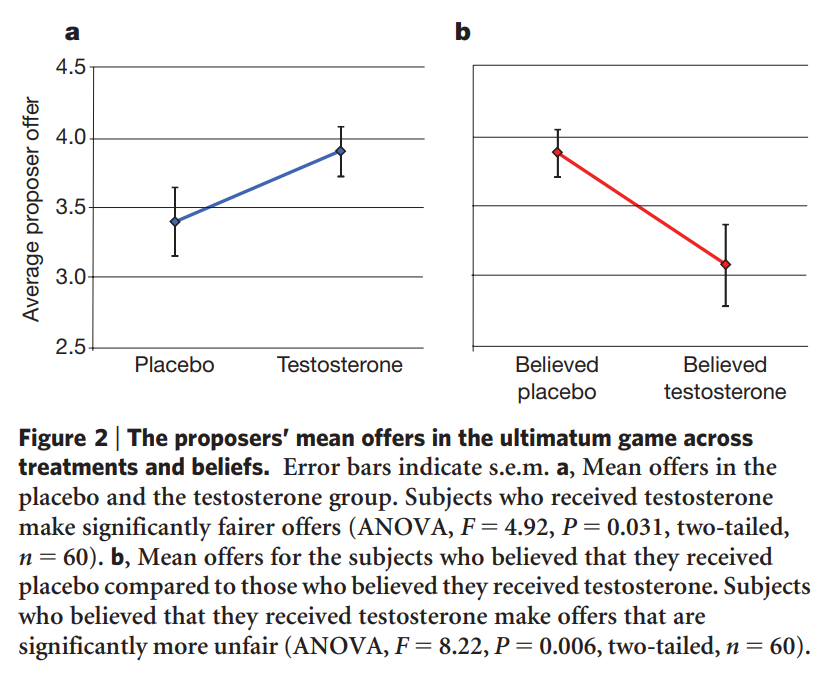
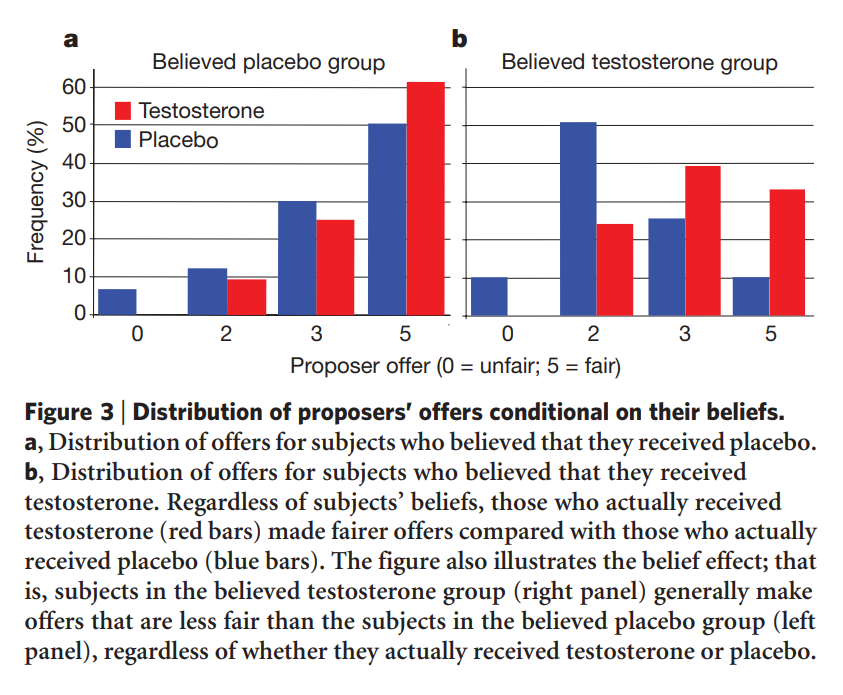
Darles testosterona a las mujeres hace que se comporten de manera más justa y menos conflictiva. Sin embargo, las mujeres que creen que han tomado testosterona —pero que en realidad han tomado placebo— se comportan de manera más agresiva y más injusta.
“Don’t Confuse Your Prescription Pad with Critical Thinking”🧐 (Mini Rant)
I’m about to say what a lot of people and patients want to say, but might not have the words.
Let’s start with an observation. I’m sure I’m not the only one who has noticed the pattern:
Some clinicians on X increasingly seem to treat credentials, prescription authority, and clinical status as though they are arguments in and of themselves.
They mock “wellness influencers,” appeal to their ability to prescribe medications, or cheer on vulgar attacks against dissenters — all while conveniently sidestepping the actual data.
They know who they are.
And more importantly, you do too.
Here’s the uncomfortable reality:
Medicine is changing.
The era of tightly gatekept information and unquestioned authority is ending. Patients are becoming more informed. Younger physicians, researchers, and scientific commutators are more willing to challenge assumptions.
Science is becoming democratized.
And that is a good thing.
To be clear, clinical experience has value. But experience alone is not infallibility. It can sharpen judgment, or reinforce confirmation bias if it’s never challenged by data, humility, or self-reflection.
Having access to a prescription pad does not automatically make someone wise, rigorous, or intellectually honest.
Otherwise stated: don’t confuse your authority over a prescription pad with critical thinking.
Imagine being an oncologist with a patient who has stage 4 pancreatic cancer (5 year survival rate of 3%). The patient cures themselves and wins the 100m in the Olympics 12 years later…and the oncologist is like, “meh, got lucky… what’s for lunch?”
TLDR; doctors without curiosity are bad doctors. https://t.co/gvm5aq0QSr
🚨New Paper: "Seven Years of 700 Cholesterol Without Coronary Atherosclerosis: A Lean Mass Hyper-Responder Case Report"
Link: https://t.co/5VnRpZlFdR
For the past 7 years, I’ve been running what is essentially a natural experiment in cholesterol and heart health.
During that time, I’ve largely lived with:
👉Total cholesterol around 700 mg/dl
👉LDL cholesterol between 500–600 mg/dL
I recently underwent advanced coronary CT angiography imaging with AI-guided analysis. This is not a CAC. It measures all plaque (soft + calcified), with expert interpretation and AI-guided analysis capable of quantifying plaque down to the cubic millimeter (mm3).
Now, to address the obvious question:
Am I too young for plaque?
In brief: No.
The clearest comparison is individuals with homozygous familial hypercholesterolemia, who often have similarly extreme LDL/ApoB levels and can develop advanced plaque as toddlers, and even heart attacks as early as age 8.
Also, nutrition influencers in their 30s have publicly shared quantified plaque scores from these same imaging technologies. In one recent case, a plant-based influencer in his thirties was found to have 61.3 mm³ of plaque despite having far lower lifetime LDL exposure. (He can identify himself if he so chooses.)
My case also isn’t a one-off.
There are many individuals like me, including older individuals with similar LDL-C and ApoB without any plaque.
The difference is that I’m an unusually well-characterized subject, with extensive metabolic data and health markers tracked over time. You can learn more at the newsletter or open-access paper, linked above.
The science of heart health is not settled. And cholesterol is not a simple story.
🚨 If you want to help spread the word...
Quote Tweet this post (or create an original post) including the article link with a thought. Academic papers are increasingly evaluated using attention metrics. Original posts from unique users are one way to increase these metrics and help ultimately increase its reach.
🚨 If you want to learn more, I'll include more learning resources below 👇
Five points for you, Mr Scott (link below)
First, hoFH children with similar levels and lesser cumulative LDL exposure have had fatal events.
Second, I think it’s “stupid” for you to presume to know what I’ve been told by physicians on my journey as a patient.
Third, I think it’s “extremely dishonest” of you to completely avoid presenting the results as I present them in the context of the literature, methodology, and other cases.
Fourth, for those who actually read the content, it seems like the majority opinion is positive. Cc @TuitNutrition (thanks)
Fifth, I’ll have more to say when the paper (accepted), is published. So if this is hitting a nerve…. I suggest you reserve some cortisol for what’s coming next so you don’t burn out your adrenals, respectfully.
For those who want early access they can see my newsletter from today at Substack
https://t.co/lOeBDS2Fma
Peter Misses the Plot: a Swift Debunking 👇
It’s come to my attention that @PeterAttiaMD has come out with an attempted debunk to The Cholesterol Code documentary and, more broadly, the research on lean mass hyper-responders.
I won’t mince words: It’s embarrassing. It’s simultaneously arrogant, deeply misinformed, and, as I read it, a transparent avoidance of the facts at hand. It’s posturing, not insight. And I’m prepared to back that up.
First, Peter attempts to discredit the documentary, the research on lean mass hyper-responders, and the Lipid Energy Model, on superficial grounds: credentials and authority.
He almost exclusively referring to the work as a product of the Citizen Science Foundation (CSF), i.e., @realDaveFeldman: the 'uncredentialed' outsider.
He conspicuously avoids discussing the broader teams involved, many of whom carry credentials that would easily meet the standards typically valued in more traditional, credential-focused settings (and exceed his own). Even setting aside myself, an MD-PhD, there is: Dr. Adrian Soto-Mota, MD-PhD, ith the Lundquist team, there are others who have co-authored work in this space, including Anatol Kontush, Ronald Krauss, William Cromwell, and, notably, Peter’s own former head of research, Bob Kaplan. Go figure.
Might have been a fact fact for Peter to include: "My former head of research was a coauthor on the Lipid Energy Model paper I'm inadequately trying to debunk."
And that’s the short list.
I’ll also point out that when I was writing an editorial on lean mass hyper-responders, I reached out to Peter, and he declined to contribute, citing that it was not his area of expertise.
He instead referred me to Ronald Krauss at “the expert,” who has now collaborated with us on a couple of projects.
So even at a superficial level, what we’re seeing here is avoidance, posturing, and frank hypocrisy.
Peter further attempts to cast doubt on lean mass hyper-responders by questioning the existence of the phenotype, which is, frankly, comical. It exists. It is defined by three clear cut points, and people meeting those criteria unquestionably exist. It is also a dynamic and reproducible phenomenon, as demonstrated by multiple experiments, case series, and even meta-analyses of randomized controlled trials that we have published. Peter forgot to talk about those data. No surprise there.
Peter also demonstrates a misunderstanding of the Lipid Energy Model, for example by incorrectly suggesting a contradiction between the model and the low triglycerides observed in lean mass hyper-responders. And, more broadly, he reveals a lack of familiarity with the practical realities and constraints of clinical study design. If we are going to lean on authority, then it is fair to ask about experience. To my knowledge, Peter has not conducted clinical trials, and frankly, that gap shows here.
At a deeper level, I don’t think Peter understands this physiology or this domain. And behavior like this, particularly when presented under the banner of scientific critique, is exactly the kind of thing that fuels “broader distrust in institutions and experts.”
This is a textbook case of the pot calling the kettle black.
I could go on, but I think the core point is clear. If further discourse is needed, Peter and his colleagues, including Tom Dayspring, have had ample opportunity to engage, collaborate, and discuss these ideas directly.
If they choose not to, that speaks for itself.
In the meantime, we’re not going anywhere. And no amount of pedantic posturing is going to change the trajectory of the data.
Oh, and two more things…
i. For those tempted to fall back on the overly simplistic take that “they’re saying high LDL is good” and “fear mongering about pharma,” or similar caricatures, you’ve entirely missed the plot.
And, I have something coming this week.
Again, if you interpret it as a pivot, you’ve missed the point entirely, as Peter has.
ii. Finally, Peter’s central criticism seems to be that the documentary and our research suggest that even very high LDL cholesterol may not always indicate cardiovascular risk.
Well, yes.
The alternative is to argue that in all circumstances, at all times, very high LDL necessarily drives cardiovascular disease.
This isn’t about discrediting, with a blanket statement, any role of ApoB or LDL in cardiovascular disease. This is about asking important questions at the frontier of science, because the status quo has been wholly inadequate in addressing the problem at hand.
That's obvious.
At least to some extent, we have been barking up the wrong tree.
Anyone with a modicum of perspective can see that.
And anyone with genuine curiosity would be willing to engage with the nuance, rather than lecture, avoid, and misrepresent, as Peter is doing here.
Lastly: See the Cholesterol Code Documentary. It's on Amazon. And judge for yourself.
I want to share a crucial update on our study, KETO-CTA.
(The video for this article is in the next tweet)
Our study recruited 100 participants, each undergoing two high-resolution heart scans, known as CT angiograms, one year apart. (For more background on this study design, see preprint in the following tweet)
There are now four analyses of those same 200 scans. But one of those analyses stands out — and I have some new developments to report.
For a quick background, the first quantitative analysis was from an AI company, Cleerly. We published their analysis of our scans last year.
After the paper was published, the Citizen Science Foundation was free to look at the raw Cleerly data, and we found a number of patterns that appeared different from what is typically seen in other coronary plaque studies.
For example, in Cleerly's analysis, not one of the participants showed lower plaque levels at follow-up — even though CTA scans typically show some natural variation in both directions, especially in people who start with very little plaque.
For another example within their data, people with no detectable calcium in their scans appeared to have several times more plaque progression than those who already had some calcium present. This runs counter to what many in cardiology call the "power of zero" — the well-established finding that having no coronary calcium is typically associated with lower risk and slower disease progression.
Another major development: shortly after publication, we learned that the scans Cleerly was analyzing were not fully blinded. In studies like this, the order of scans is typically kept unknown to the analyst to help prevent any potential for bias. But in this case, the chronological order was available in the scans. We therefore asked Cleerly to repeat their analysis using a properly blinded set of scans, which is standard practice in longitudinal studies. Cleerly declined to perform a blinded reanalysis.
Because of this, we commissioned an additional, independent analysis from Heartflow. Heartflow has been a leader in this space and is the most extensively validated AI platform for coronary CTA analysis.
The Heartflow analysis was conducted with full operational blinding and completed right before the prespecified third, and final quantitative analysis, which uses Medis QAngio. These two independent platforms were consistent with each other, yet both differed substantially from the Cleerly results.
As these independent results became available, we shared them privately with Cleerly and again requested a blinded reanalysis of their original work. We offered to cover any costs involved just in case this was the barrier to reanalysis. Cleerly again declined.
However, a new development emerged. Several participants requested their scans from the study and submitted them directly through their own, personal cardiologist. Any cardiologist with a proper Cleerly account can appropriately submit scans on their patient's behalf.
So in a sense, our participants themselves were able to provide a portion of the blinded analysis we were originally requesting. This was then shared with me on behalf of the Citizen Science Foundation. In total, there are 19 of these individual submissions — about 10% of the total scans in our study so far.
Individual Submissions vs. Study Data
We focused on the 8 participants who have both a baseline and a follow-up individual submission of their scans (the other 3 submissions are unpaired).
[Please Note: These data are preliminary]
Figure 1 compares the change in soft plaque (Non-Calcified Plaque Volume or NCPV) reported by the original Cleerly study analysis against the results from each participant's individual submission. [See Figure 1]
Of the 8 participants, four showed an increase in soft plaque in both datasets — but in three of those four cases, the individual submissions reported substantially less progression than the study data. The remaining four participants all showed progression in the study data, yet every one of their individual submissions showed a decrease — a complete reversal of direction. The largest discrepancy was a single participant whose study data reported an increase of 32 mm³, while their individual submission showed a decrease of 48 mm³ — a reversal of approximately 80 mm³.
The median change in soft plaque for these 8 participants was +20.6 mm³ (a 31% increase) in the original study data, compared to just +0.7 mm³ (about a 2% increase) from their individual submissions (Figure 2).
The mean average is even more pronounced: the study data shows an average increase of +20.9 mm³ (42% from baseline), while the individual submissions show an average decrease of 5.1 mm³ (an 8% decline). In other words, the study data says plaque went up; the individual submissions say it went down (Figure 3).
Direction of Change Across Platforms
To put these individual submissions in broader context, Figure 4 compares the direction of soft plaque change across three analyses of these same scans.
On the left is the original Cleerly study analysis — 99 participants after excluding one who had a procedure between scans. 98% showed an increase in soft plaque. Only 2 showed no change. Zero showed regression.
In the middle are the 8 individual submissions, split right down the middle: 50% showing progression and 50% showing regression. On the right is the full Heartflow analysis across 95 participants.
While 8 is a small sample size, the direction-of-change in these individual submissions is far closer to the Heartflow analysis than the original Cleerly analysis. It is worth emphasizing: 4 out of the 8 participants — fully half — received individual submission results showing less plaque in their second scan than their first. But after accounting for the single exclusion mentioned above, not one of the 99 participants in the original Cleerly study analysis showed plaque regression.
We are not sure what happened with the original Cleerly analysis. We just know the other analyses are largely consistent with each other — and now, that includes these individual submissions to Cleerly as well.
Next Steps
We have already taken steps regarding last year's paper that contained the original Cleerly analysis. We are working with the journal on that now, and we expect news on this very soon.
In the meantime, the preprint of our current paper with both Heartflow and QAngio results is available at the link below.
Importantly, the two principal findings reported in the original paper have been reproduced in both the Heartflow and QAngio analyses:
(1) baseline plaque strongly predicts future plaque progression, and
(2) ApoB was not associated with plaque progression
I want to once again thank Dr. Budoff and the Lundquist team for providing these scans to study participants who request them.
If you are a participant in our study and interested in sending in your scans through your cardiologist, we now have a budget to help cover the cost of that submission. You can contact us at [email protected] for more details.
Thank you again to everyone for your support. 🙏
cc @nicknorwitz@AdrianSotoMota
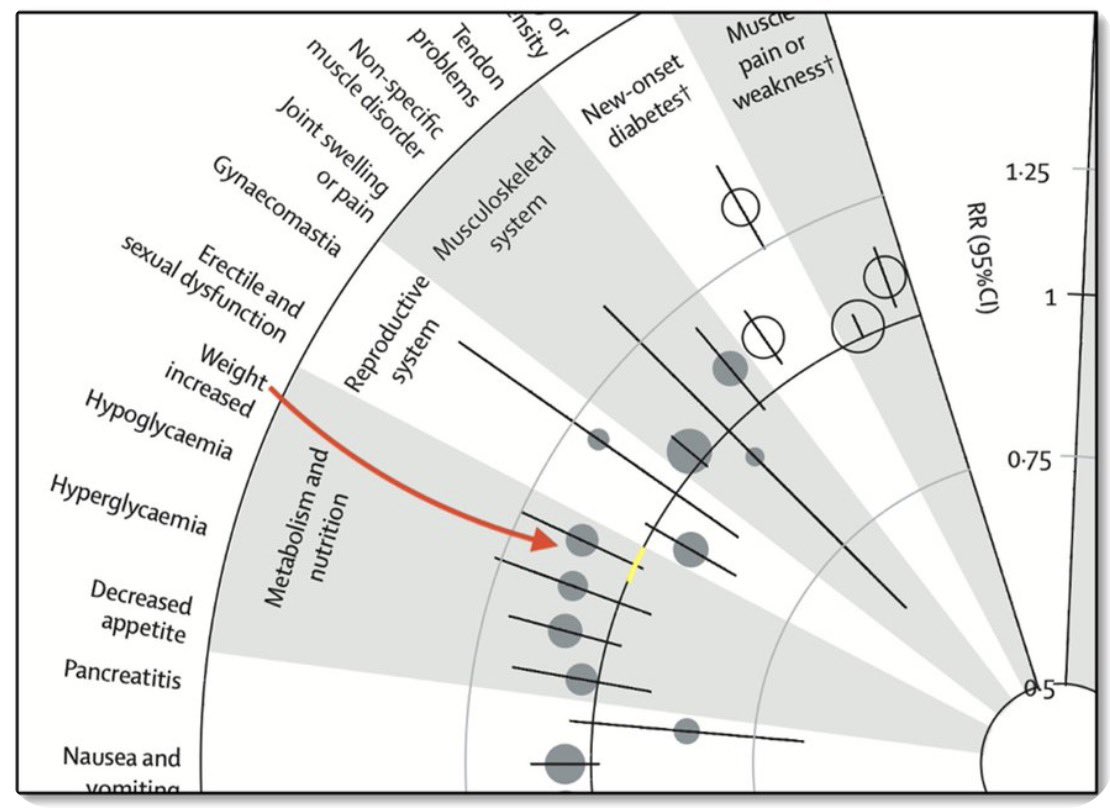
Statins cause weight gain in meta-analysis of RCTs (Lancet 2015)
👉Mild but statistically significant weight gain over (can compound)
Mechanisms include:
👉Reduced Leptin
👉Reduced GLP-1
👉HMGCR inhibition
Regarding the more recent 2026 Lancet meta-analysis, see today's long-form video on YouTube.
Do Statins make you Fat?
Got your attention. Good. Now hear me out. 👂👇
The new headlines around this new Lancet study screaming that “millions more” should be on statins and that “side effects have been overblown” are absurd distortions of reality.
Take weight change (Figure 1).
There was a clear trend showing statin use was “causally” linked with weight gain versus placebo (missed statistical significance by a hair; yellow line).
AND there was also a dose–response trend (Figure 2): high-dose statins trended toward more weight gain than low-dose statins (also missed statistical significance by a hair).
🚨Here’s the problem:
Just because something doesn’t cross an arbitrary p-value threshold does not mean there’s no biological effect.
If I’m 90% sure jumping off a cliff will kill me—but that’s “not statistically significant”—does that mean it’s safe?
Of course not.
Absence of statistical significance ≠ absence of harm.
(And maybe it’s not my place to speculate on whether conflicts of interest—including with Merck, AstraZeneca, Eli Lilly, Novartis, Amgen, Pfizer—influenced which tests they ran and what they chose to emphasize... but FWIW to you ��🏼)
Many more thoughts in the full letter 👇
The Statin Data @PeterAttiaMD Deleted
I was surprised to find in a commentary on a human study showing Statins Slash GLP-1 levels Petter omitted the key graph
When you omit the most important graph, that's not nuance. It's curation.
👉Full video: https://t.co/WeUuYQ69QG
Someone asked, "Does cardiology really have an LDL obsession?"
I messaged them this tweet. While most cardiologists would not be so imprecise with their language, the fact that this position exists at all is an intellectual, scientific, and medical embarrassment.
Why Are We Still Playing "Cholesterol Uno?" 🤔👇
(85 sec clip, link to full video below)
"When faced with data showing that “optimal” LDL-C levels fail to prevent atherosclerosis, the final retreat is almost always the same: the LDL-C just wasn���t low enough. “Lower is better” the mantra goes.
If a mean LDL of 57 mg/dL isn’t sufficient to make atherosclerosis an orphan disease, then the solution must be 40. Or 30. Or 20. Or even 10 mg/dL. Heck, let’s just try to hit zero like we’re playing cholesterol Uno…
What this reflexive response reveals is the profound keyhole thinking that has come to dominate conventional cardiology
Medicine has become so siloed and sub-specialized that success is often defined within the narrow boundaries of a single biomarker or organ system, rather than in terms of whole-person health.
It is entirely possible—at least in theory—that taking a sledgehammer to LDL-C and ApoB, driving them as close to zero as possible, could further reduce cardiovascular events.
But that framing dodges the far more important question: what are we trading? Because LDL-lowering therapies are not benign."




![realDaveFeldman's tweet photo. I want to share a crucial update on our study, KETO-CTA.
(The video for this article is in the next tweet)
Our study recruited 100 participants, each undergoing two high-resolution heart scans, known as CT angiograms, one year apart. (For more background on this study design, see preprint in the following tweet)
There are now four analyses of those same 200 scans. But one of those analyses stands out — and I have some new developments to report.
For a quick background, the first quantitative analysis was from an AI company, Cleerly. We published their analysis of our scans last year.
After the paper was published, the Citizen Science Foundation was free to look at the raw Cleerly data, and we found a number of patterns that appeared different from what is typically seen in other coronary plaque studies.
For example, in Cleerly's analysis, not one of the participants showed lower plaque levels at follow-up — even though CTA scans typically show some natural variation in both directions, especially in people who start with very little plaque.
For another example within their data, people with no detectable calcium in their scans appeared to have several times more plaque progression than those who already had some calcium present. This runs counter to what many in cardiology call the "power of zero" — the well-established finding that having no coronary calcium is typically associated with lower risk and slower disease progression.
Another major development: shortly after publication, we learned that the scans Cleerly was analyzing were not fully blinded. In studies like this, the order of scans is typically kept unknown to the analyst to help prevent any potential for bias. But in this case, the chronological order was available in the scans. We therefore asked Cleerly to repeat their analysis using a properly blinded set of scans, which is standard practice in longitudinal studies. Cleerly declined to perform a blinded reanalysis.
Because of this, we commissioned an additional, independent analysis from Heartflow. Heartflow has been a leader in this space and is the most extensively validated AI platform for coronary CTA analysis.
The Heartflow analysis was conducted with full operational blinding and completed right before the prespecified third, and final quantitative analysis, which uses Medis QAngio. These two independent platforms were consistent with each other, yet both differed substantially from the Cleerly results.
As these independent results became available, we shared them privately with Cleerly and again requested a blinded reanalysis of their original work. We offered to cover any costs involved just in case this was the barrier to reanalysis. Cleerly again declined.
However, a new development emerged. Several participants requested their scans from the study and submitted them directly through their own, personal cardiologist. Any cardiologist with a proper Cleerly account can appropriately submit scans on their patient's behalf.
So in a sense, our participants themselves were able to provide a portion of the blinded analysis we were originally requesting. This was then shared with me on behalf of the Citizen Science Foundation. In total, there are 19 of these individual submissions — about 10% of the total scans in our study so far.
Individual Submissions vs. Study Data
We focused on the 8 participants who have both a baseline and a follow-up individual submission of their scans (the other 3 submissions are unpaired).
[Please Note: These data are preliminary]
Figure 1 compares the change in soft plaque (Non-Calcified Plaque Volume or NCPV) reported by the original Cleerly study analysis against the results from each participant's individual submission. [See Figure 1]
Of the 8 participants, four showed an increase in soft plaque in both datasets — but in three of those four cases, the individual submissions reported substantially less progression than the study data. The remaining four participants all showed progression in the study data, yet every one of their individual submissions showed a decrease — a complete reversal of direction. The largest discrepancy was a single participant whose study data reported an increase of 32 mm³, while their individual submission showed a decrease of 48 mm³ — a reversal of approximately 80 mm³.
The median change in soft plaque for these 8 participants was +20.6 mm³ (a 31% increase) in the original study data, compared to just +0.7 mm³ (about a 2% increase) from their individual submissions (Figure 2).
The mean average is even more pronounced: the study data shows an average increase of +20.9 mm³ (42% from baseline), while the individual submissions show an average decrease of 5.1 mm³ (an 8% decline). In other words, the study data says plaque went up; the individual submissions say it went down (Figure 3).
Direction of Change Across Platforms
To put these individual submissions in broader context, Figure 4 compares the direction of soft plaque change across three analyses of these same scans.
On the left is the original Cleerly study analysis — 99 participants after excluding one who had a procedure between scans. 98% showed an increase in soft plaque. Only 2 showed no change. Zero showed regression.
In the middle are the 8 individual submissions, split right down the middle: 50% showing progression and 50% showing regression. On the right is the full Heartflow analysis across 95 participants.
While 8 is a small sample size, the direction-of-change in these individual submissions is far closer to the Heartflow analysis than the original Cleerly analysis. It is worth emphasizing: 4 out of the 8 participants — fully half — received individual submission results showing less plaque in their second scan than their first. But after accounting for the single exclusion mentioned above, not one of the 99 participants in the original Cleerly study analysis showed plaque regression.
We are not sure what happened with the original Cleerly analysis. We just know the other analyses are largely consistent with each other — and now, that includes these individual submissions to Cleerly as well.
Next Steps
We have already taken steps regarding last year's paper that contained the original Cleerly analysis. We are working with the journal on that now, and we expect news on this very soon.
In the meantime, the preprint of our current paper with both Heartflow and QAngio results is available at the link below.
Importantly, the two principal findings reported in the original paper have been reproduced in both the Heartflow and QAngio analyses:
(1) baseline plaque strongly predicts future plaque progression, and
(2) ApoB was not associated with plaque progression
I want to once again thank Dr. Budoff and the Lundquist team for providing these scans to study participants who request them.
If you are a participant in our study and interested in sending in your scans through your cardiologist, we now have a budget to help cover the cost of that submission. You can contact us at info@citizensciencefoundation.org for more details.
Thank you again to everyone for your support. 🙏
cc @nicknorwitz @AdrianSotoMota](https://pbs.twimg.com/media/HCX8j46a4AAib6Q.png)
![realDaveFeldman's tweet photo. I want to share a crucial update on our study, KETO-CTA.
(The video for this article is in the next tweet)
Our study recruited 100 participants, each undergoing two high-resolution heart scans, known as CT angiograms, one year apart. (For more background on this study design, see preprint in the following tweet)
There are now four analyses of those same 200 scans. But one of those analyses stands out — and I have some new developments to report.
For a quick background, the first quantitative analysis was from an AI company, Cleerly. We published their analysis of our scans last year.
After the paper was published, the Citizen Science Foundation was free to look at the raw Cleerly data, and we found a number of patterns that appeared different from what is typically seen in other coronary plaque studies.
For example, in Cleerly's analysis, not one of the participants showed lower plaque levels at follow-up — even though CTA scans typically show some natural variation in both directions, especially in people who start with very little plaque.
For another example within their data, people with no detectable calcium in their scans appeared to have several times more plaque progression than those who already had some calcium present. This runs counter to what many in cardiology call the "power of zero" — the well-established finding that having no coronary calcium is typically associated with lower risk and slower disease progression.
Another major development: shortly after publication, we learned that the scans Cleerly was analyzing were not fully blinded. In studies like this, the order of scans is typically kept unknown to the analyst to help prevent any potential for bias. But in this case, the chronological order was available in the scans. We therefore asked Cleerly to repeat their analysis using a properly blinded set of scans, which is standard practice in longitudinal studies. Cleerly declined to perform a blinded reanalysis.
Because of this, we commissioned an additional, independent analysis from Heartflow. Heartflow has been a leader in this space and is the most extensively validated AI platform for coronary CTA analysis.
The Heartflow analysis was conducted with full operational blinding and completed right before the prespecified third, and final quantitative analysis, which uses Medis QAngio. These two independent platforms were consistent with each other, yet both differed substantially from the Cleerly results.
As these independent results became available, we shared them privately with Cleerly and again requested a blinded reanalysis of their original work. We offered to cover any costs involved just in case this was the barrier to reanalysis. Cleerly again declined.
However, a new development emerged. Several participants requested their scans from the study and submitted them directly through their own, personal cardiologist. Any cardiologist with a proper Cleerly account can appropriately submit scans on their patient's behalf.
So in a sense, our participants themselves were able to provide a portion of the blinded analysis we were originally requesting. This was then shared with me on behalf of the Citizen Science Foundation. In total, there are 19 of these individual submissions — about 10% of the total scans in our study so far.
Individual Submissions vs. Study Data
We focused on the 8 participants who have both a baseline and a follow-up individual submission of their scans (the other 3 submissions are unpaired).
[Please Note: These data are preliminary]
Figure 1 compares the change in soft plaque (Non-Calcified Plaque Volume or NCPV) reported by the original Cleerly study analysis against the results from each participant's individual submission. [See Figure 1]
Of the 8 participants, four showed an increase in soft plaque in both datasets — but in three of those four cases, the individual submissions reported substantially less progression than the study data. The remaining four participants all showed progression in the study data, yet every one of their individual submissions showed a decrease — a complete reversal of direction. The largest discrepancy was a single participant whose study data reported an increase of 32 mm³, while their individual submission showed a decrease of 48 mm³ — a reversal of approximately 80 mm³.
The median change in soft plaque for these 8 participants was +20.6 mm³ (a 31% increase) in the original study data, compared to just +0.7 mm³ (about a 2% increase) from their individual submissions (Figure 2).
The mean average is even more pronounced: the study data shows an average increase of +20.9 mm³ (42% from baseline), while the individual submissions show an average decrease of 5.1 mm³ (an 8% decline). In other words, the study data says plaque went up; the individual submissions say it went down (Figure 3).
Direction of Change Across Platforms
To put these individual submissions in broader context, Figure 4 compares the direction of soft plaque change across three analyses of these same scans.
On the left is the original Cleerly study analysis — 99 participants after excluding one who had a procedure between scans. 98% showed an increase in soft plaque. Only 2 showed no change. Zero showed regression.
In the middle are the 8 individual submissions, split right down the middle: 50% showing progression and 50% showing regression. On the right is the full Heartflow analysis across 95 participants.
While 8 is a small sample size, the direction-of-change in these individual submissions is far closer to the Heartflow analysis than the original Cleerly analysis. It is worth emphasizing: 4 out of the 8 participants — fully half — received individual submission results showing less plaque in their second scan than their first. But after accounting for the single exclusion mentioned above, not one of the 99 participants in the original Cleerly study analysis showed plaque regression.
We are not sure what happened with the original Cleerly analysis. We just know the other analyses are largely consistent with each other — and now, that includes these individual submissions to Cleerly as well.
Next Steps
We have already taken steps regarding last year's paper that contained the original Cleerly analysis. We are working with the journal on that now, and we expect news on this very soon.
In the meantime, the preprint of our current paper with both Heartflow and QAngio results is available at the link below.
Importantly, the two principal findings reported in the original paper have been reproduced in both the Heartflow and QAngio analyses:
(1) baseline plaque strongly predicts future plaque progression, and
(2) ApoB was not associated with plaque progression
I want to once again thank Dr. Budoff and the Lundquist team for providing these scans to study participants who request them.
If you are a participant in our study and interested in sending in your scans through your cardiologist, we now have a budget to help cover the cost of that submission. You can contact us at info@citizensciencefoundation.org for more details.
Thank you again to everyone for your support. 🙏
cc @nicknorwitz @AdrianSotoMota](https://pbs.twimg.com/media/HCX8ibSbEAAkKJm.png)
![realDaveFeldman's tweet photo. I want to share a crucial update on our study, KETO-CTA.
(The video for this article is in the next tweet)
Our study recruited 100 participants, each undergoing two high-resolution heart scans, known as CT angiograms, one year apart. (For more background on this study design, see preprint in the following tweet)
There are now four analyses of those same 200 scans. But one of those analyses stands out — and I have some new developments to report.
For a quick background, the first quantitative analysis was from an AI company, Cleerly. We published their analysis of our scans last year.
After the paper was published, the Citizen Science Foundation was free to look at the raw Cleerly data, and we found a number of patterns that appeared different from what is typically seen in other coronary plaque studies.
For example, in Cleerly's analysis, not one of the participants showed lower plaque levels at follow-up — even though CTA scans typically show some natural variation in both directions, especially in people who start with very little plaque.
For another example within their data, people with no detectable calcium in their scans appeared to have several times more plaque progression than those who already had some calcium present. This runs counter to what many in cardiology call the "power of zero" — the well-established finding that having no coronary calcium is typically associated with lower risk and slower disease progression.
Another major development: shortly after publication, we learned that the scans Cleerly was analyzing were not fully blinded. In studies like this, the order of scans is typically kept unknown to the analyst to help prevent any potential for bias. But in this case, the chronological order was available in the scans. We therefore asked Cleerly to repeat their analysis using a properly blinded set of scans, which is standard practice in longitudinal studies. Cleerly declined to perform a blinded reanalysis.
Because of this, we commissioned an additional, independent analysis from Heartflow. Heartflow has been a leader in this space and is the most extensively validated AI platform for coronary CTA analysis.
The Heartflow analysis was conducted with full operational blinding and completed right before the prespecified third, and final quantitative analysis, which uses Medis QAngio. These two independent platforms were consistent with each other, yet both differed substantially from the Cleerly results.
As these independent results became available, we shared them privately with Cleerly and again requested a blinded reanalysis of their original work. We offered to cover any costs involved just in case this was the barrier to reanalysis. Cleerly again declined.
However, a new development emerged. Several participants requested their scans from the study and submitted them directly through their own, personal cardiologist. Any cardiologist with a proper Cleerly account can appropriately submit scans on their patient's behalf.
So in a sense, our participants themselves were able to provide a portion of the blinded analysis we were originally requesting. This was then shared with me on behalf of the Citizen Science Foundation. In total, there are 19 of these individual submissions — about 10% of the total scans in our study so far.
Individual Submissions vs. Study Data
We focused on the 8 participants who have both a baseline and a follow-up individual submission of their scans (the other 3 submissions are unpaired).
[Please Note: These data are preliminary]
Figure 1 compares the change in soft plaque (Non-Calcified Plaque Volume or NCPV) reported by the original Cleerly study analysis against the results from each participant's individual submission. [See Figure 1]
Of the 8 participants, four showed an increase in soft plaque in both datasets — but in three of those four cases, the individual submissions reported substantially less progression than the study data. The remaining four participants all showed progression in the study data, yet every one of their individual submissions showed a decrease — a complete reversal of direction. The largest discrepancy was a single participant whose study data reported an increase of 32 mm³, while their individual submission showed a decrease of 48 mm³ — a reversal of approximately 80 mm³.
The median change in soft plaque for these 8 participants was +20.6 mm³ (a 31% increase) in the original study data, compared to just +0.7 mm³ (about a 2% increase) from their individual submissions (Figure 2).
The mean average is even more pronounced: the study data shows an average increase of +20.9 mm³ (42% from baseline), while the individual submissions show an average decrease of 5.1 mm³ (an 8% decline). In other words, the study data says plaque went up; the individual submissions say it went down (Figure 3).
Direction of Change Across Platforms
To put these individual submissions in broader context, Figure 4 compares the direction of soft plaque change across three analyses of these same scans.
On the left is the original Cleerly study analysis — 99 participants after excluding one who had a procedure between scans. 98% showed an increase in soft plaque. Only 2 showed no change. Zero showed regression.
In the middle are the 8 individual submissions, split right down the middle: 50% showing progression and 50% showing regression. On the right is the full Heartflow analysis across 95 participants.
While 8 is a small sample size, the direction-of-change in these individual submissions is far closer to the Heartflow analysis than the original Cleerly analysis. It is worth emphasizing: 4 out of the 8 participants — fully half — received individual submission results showing less plaque in their second scan than their first. But after accounting for the single exclusion mentioned above, not one of the 99 participants in the original Cleerly study analysis showed plaque regression.
We are not sure what happened with the original Cleerly analysis. We just know the other analyses are largely consistent with each other — and now, that includes these individual submissions to Cleerly as well.
Next Steps
We have already taken steps regarding last year's paper that contained the original Cleerly analysis. We are working with the journal on that now, and we expect news on this very soon.
In the meantime, the preprint of our current paper with both Heartflow and QAngio results is available at the link below.
Importantly, the two principal findings reported in the original paper have been reproduced in both the Heartflow and QAngio analyses:
(1) baseline plaque strongly predicts future plaque progression, and
(2) ApoB was not associated with plaque progression
I want to once again thank Dr. Budoff and the Lundquist team for providing these scans to study participants who request them.
If you are a participant in our study and interested in sending in your scans through your cardiologist, we now have a budget to help cover the cost of that submission. You can contact us at info@citizensciencefoundation.org for more details.
Thank you again to everyone for your support. 🙏
cc @nicknorwitz @AdrianSotoMota](https://pbs.twimg.com/media/HCX8ebga0AARj_o.png)







![realDaveFeldman's tweet photo. I want to share a crucial update on our study, KETO-CTA.
(The video for this article is in the next tweet)
Our study recruited 100 participants, each undergoing two high-resolution heart scans, known as CT angiograms, one year apart. (For more background on this study design, see preprint in the following tweet)
There are now four analyses of those same 200 scans. But one of those analyses stands out — and I have some new developments to report.
For a quick background, the first quantitative analysis was from an AI company, Cleerly. We published their analysis of our scans last year.
After the paper was published, the Citizen Science Foundation was free to look at the raw Cleerly data, and we found a number of patterns that appeared different from what is typically seen in other coronary plaque studies.
For example, in Cleerly's analysis, not one of the participants showed lower plaque levels at follow-up — even though CTA scans typically show some natural variation in both directions, especially in people who start with very little plaque.
For another example within their data, people with no detectable calcium in their scans appeared to have several times more plaque progression than those who already had some calcium present. This runs counter to what many in cardiology call the "power of zero" — the well-established finding that having no coronary calcium is typically associated with lower risk and slower disease progression.
Another major development: shortly after publication, we learned that the scans Cleerly was analyzing were not fully blinded. In studies like this, the order of scans is typically kept unknown to the analyst to help prevent any potential for bias. But in this case, the chronological order was available in the scans. We therefore asked Cleerly to repeat their analysis using a properly blinded set of scans, which is standard practice in longitudinal studies. Cleerly declined to perform a blinded reanalysis.
Because of this, we commissioned an additional, independent analysis from Heartflow. Heartflow has been a leader in this space and is the most extensively validated AI platform for coronary CTA analysis.
The Heartflow analysis was conducted with full operational blinding and completed right before the prespecified third, and final quantitative analysis, which uses Medis QAngio. These two independent platforms were consistent with each other, yet both differed substantially from the Cleerly results.
As these independent results became available, we shared them privately with Cleerly and again requested a blinded reanalysis of their original work. We offered to cover any costs involved just in case this was the barrier to reanalysis. Cleerly again declined.
However, a new development emerged. Several participants requested their scans from the study and submitted them directly through their own, personal cardiologist. Any cardiologist with a proper Cleerly account can appropriately submit scans on their patient's behalf.
So in a sense, our participants themselves were able to provide a portion of the blinded analysis we were originally requesting. This was then shared with me on behalf of the Citizen Science Foundation. In total, there are 19 of these individual submissions — about 10% of the total scans in our study so far.
Individual Submissions vs. Study Data
We focused on the 8 participants who have both a baseline and a follow-up individual submission of their scans (the other 3 submissions are unpaired).
[Please Note: These data are preliminary]
Figure 1 compares the change in soft plaque (Non-Calcified Plaque Volume or NCPV) reported by the original Cleerly study analysis against the results from each participant's individual submission. [See Figure 1]
Of the 8 participants, four showed an increase in soft plaque in both datasets — but in three of those four cases, the individual submissions reported substantially less progression than the study data. The remaining four participants all showed progression in the study data, yet every one of their individual submissions showed a decrease — a complete reversal of direction. The largest discrepancy was a single participant whose study data reported an increase of 32 mm³, while their individual submission showed a decrease of 48 mm³ — a reversal of approximately 80 mm³.
The median change in soft plaque for these 8 participants was +20.6 mm³ (a 31% increase) in the original study data, compared to just +0.7 mm³ (about a 2% increase) from their individual submissions (Figure 2).
The mean average is even more pronounced: the study data shows an average increase of +20.9 mm³ (42% from baseline), while the individual submissions show an average decrease of 5.1 mm³ (an 8% decline). In other words, the study data says plaque went up; the individual submissions say it went down (Figure 3).
Direction of Change Across Platforms
To put these individual submissions in broader context, Figure 4 compares the direction of soft plaque change across three analyses of these same scans.
On the left is the original Cleerly study analysis — 99 participants after excluding one who had a procedure between scans. 98% showed an increase in soft plaque. Only 2 showed no change. Zero showed regression.
In the middle are the 8 individual submissions, split right down the middle: 50% showing progression and 50% showing regression. On the right is the full Heartflow analysis across 95 participants.
While 8 is a small sample size, the direction-of-change in these individual submissions is far closer to the Heartflow analysis than the original Cleerly analysis. It is worth emphasizing: 4 out of the 8 participants — fully half — received individual submission results showing less plaque in their second scan than their first. But after accounting for the single exclusion mentioned above, not one of the 99 participants in the original Cleerly study analysis showed plaque regression.
We are not sure what happened with the original Cleerly analysis. We just know the other analyses are largely consistent with each other — and now, that includes these individual submissions to Cleerly as well.
Next Steps
We have already taken steps regarding last year's paper that contained the original Cleerly analysis. We are working with the journal on that now, and we expect news on this very soon.
In the meantime, the preprint of our current paper with both Heartflow and QAngio results is available at the link below.
Importantly, the two principal findings reported in the original paper have been reproduced in both the Heartflow and QAngio analyses:
(1) baseline plaque strongly predicts future plaque progression, and
(2) ApoB was not associated with plaque progression
I want to once again thank Dr. Budoff and the Lundquist team for providing these scans to study participants who request them.
If you are a participant in our study and interested in sending in your scans through your cardiologist, we now have a budget to help cover the cost of that submission. You can contact us at info@citizensciencefoundation.org for more details.
Thank you again to everyone for your support. 🙏
cc @nicknorwitz @AdrianSotoMota](https://pbs.twimg.com/media/HCX8mTYb0AA7Unn.jpg)