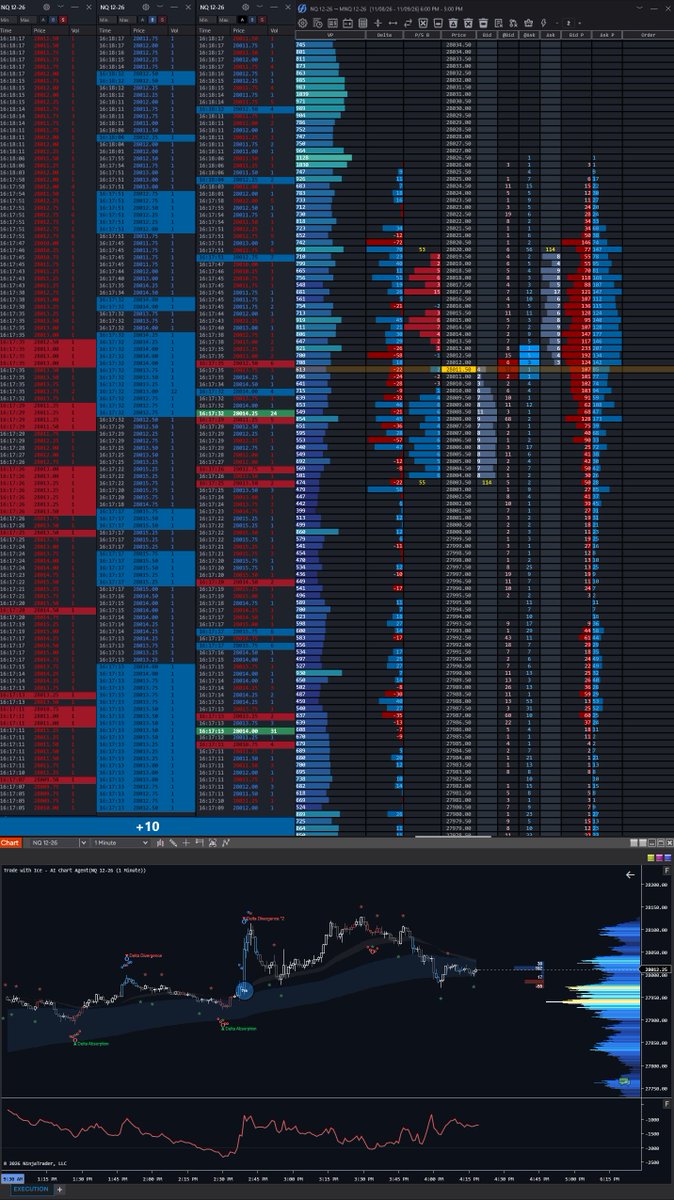
Market data comes in three levels.
L1: the tape. Every trade, price and size.
L2: the order book, totalled at each price.
L3: MBO. Every order on its own, with its own place in the queue.
CME opened L3 in 2016. Here it is on a NinjaTrader 8 DOM.
#orderflow#futures
OFLOW MBO: the individual orders behind a price level, in queue order. One big order or many small ones? Real footage, ES and NQ.
https://t.co/WnJl92OI9n
OFLOW DOM: up to 16 columns, VP + VP2 on their own periods, two DOMs + Times & Sales, chart levels mirrored in the ladder. Real footage.
https://t.co/WnJl92OI9n
Is the DOM's recent bid/ask column a good replacement for the tape?
I was recently asked a question about this in my Discord (answering here so more people can benefit from it).
The way that the tape (time and sales) works is that the more large players (institutions and funds) there are trading a given asset, then the lower the value that the tape becomes.
The tape speed ends up being way too fast to make sense of it. Using the tape for futures is like trying to drink from a fire hose. Using the DOM's recent bid/ask column slows it down and makes it more like drinking from a garden hose. Much slower and more easily manageable.
Plus the DOM adds a historical element since the DOM orders that recently happened stay on the DOM unless the market trades over it again in the future. The recent bid/ask refreshes based on the reset time you choose. I use 2500ms reset like I did back when I used Jigsaw. So, if the market moves away from a certain price and it goes more than 2.5 seconds before trading at that price again and then comes back, then it's going to overwrite the volume that was traded at that price.
The unfiltered tape is not a visually pleasing thing to be looking at. I don't use the unfiltered tape for futures.
That being said, the filtered tape that shows only large trades, such as 20+ lots on ES or 5+ lots on NQ, can be valuable. But even then, I'd only use the filtered tape for added confluence to see if big orders are coming through. I still think the DOM is more valuable than that. I personally don't pay much attention to the tape.
The value of the tape goes up a lot when you start trading in smaller speculative assets, such as small-cap stocks and small-cap cryptos, markets that don't have much institutional involvement or any at all.
So to wrap things up, the DOM is significantly better than the unfiltered tape for seeing the real-time order flow on futures. I wouldn't go anywhere near the unfiltered tape unless you're trading an asset that has little or no institutional involvement.
Oct 24, 1929: 12.9M shares, a record. The close was at 3:00 PM, but the ticker printed until about 7:08 PM, 4 hours behind. The tape printed ~4–5 characters a second. Every price on a screen has an age. #markethistory#orderflow
@DAQ_Addict Yes. Place them at .25 with the multiplier at 1, then set it back to 8 and they stay visible right where you put them. Plus and minus sit right on the DOM, so switching is quick. If you pictured it differently, let me know, always open to ideas.
OFLOW Footprint: bid × ask at every price, imbalances in the candle, stats under every candle, VWAP + profile in one chart. Real footage.
https://t.co/WnJl92OajP
OFLOW Delta Strength: one number per interval, aligned to the clock. Buyers or sellers, who was more aggressive? Real footage, incl. a closing auction.
https://t.co/WnJl92OajP
@promotions24214 The heatmap records the order book live, so it fills from the moment you load it and builds up while the chart stays open. Footprint and Profile also work on historical data.
OFLOW for NinjaTrader 8: DOM with MBO, chart levels in the DOM, news alerts, economic calendar, Depth heatmap, Footprint, TPO/volume profile. Real footage.
https://t.co/WnJl92OI9n
In electronic continuous double-auction markets (e.g., E-mini S&P 500 futures), residual cross-sectional heterogeneity of private valuations and trading horizons may be inferred from the joint behavior of the visible limit-order book and the interaction of marketable order flow with that book. Three interrelated microstructural observables permit classification of the prevailing informational and strategic regime.
1. Resilience and replenishment dynamics of opposing passive liquidity within the limit-order book.
When residual displayed and latent depth on the opposing side of the book continues to absorb aggressive marketable orders at or near previously established structural reference prices—manifested as sustained queue replenishment, iceberg refreshes, or stable top-of-book size without material adverse selection or progressive cancellation—the market continues to exhibit meaningful heterogeneity of conditional valuations. Under these conditions, the conditional distribution of subsequent returns retains a non-negligible mean-reverting component, as residual counterparties remain willing to supply liquidity against the prevailing imbalance. Conversely, progressive withdrawal of opposing depth (cancellation of resting orders, failure of iceberg replenishment, or systematic consumption of visible and inferred latent liquidity), particularly when accompanied by rising cancellation rates relative to replenishment, constitutes evidence of progressive homogenization of decision rules. The resulting contraction in residual counterparty diversity elevates the conditional probability of directional continuation and local volatility expansion, consistent with models in which correlated forecasting errors amplify rather than cancel.
2. Resolution of order-flow imbalance through absorption versus sequential reinforcement.
Sustained absorption of aggressive order flow—observable as elevated transaction volume and footprint imbalances at a given price level with limited contemporaneous displacement of the mid-price or last-traded price—implies that residual participants continue to hold sufficiently divergent conditional valuations to defend and replenish passive liquidity. This state is consistent with the maintenance of predictive diversity. By contrast, repeated fulfillment of aggressive marketable orders that produce sequential, non-reverting increments in price (positive feedback between delta and price path), especially when accompanied by thinning of the opposing side of the book and declining replenishment rates, signals progressive alignment of remaining decision processes. Once this alignment threshold is crossed, incremental aggressive flow is more likely to be accommodated by continuation than by reversion, as the book’s capacity for error cancellation and passive supply has diminished.
3. Identification of late-stage liquidity extraction against discrete concentrations of resting interest.
Following an extended directional displacement under predominantly one-sided aggressive flow and progressive depletion of opposing book depth, the subsequent targeting of discrete, high-visibility concentrations of resting stop and limit orders (prior session extremes, round-number levels, or previously defended structural prices) constitutes a liquidity-extraction event. At this stage, both displayed and latent opposing passive liquidity have typically been materially depleted, and cancellation rates on the residual opposing side often accelerate. Consequently, the marginal risk-adjusted return to further consensus continuation declines, and subsequent price resolution is more frequently determined by the character and magnitude of post-extraction absorption (or its absence) within the reconfigured book than by the extraction event itself.
Bids used to be shouted. Palm in = buy, palm out = sell, fingers = the last digit. 1992: Globex after hours. 2004: most CME volume on screens. 2015: most futures pits close. Today you see size, not names. #orderflow#DOM
Market Profile can help traders identify when a market is rejecting an area of value and where price could move next.
In this session breakdown, Mike examines sustained negative delta near the distribution highs, resting liquidity at lower prices and the market’s response after rejecting value. These signals help build a picture of selling pressure and potential areas of interest.
Watch our latest YouTube video to see how Market Profile and Order Flow can be combined to analyse market behaviour and identify potential trading opportunities - Link in bio.
#axiafutures #trading #orderflow #marketprofile #daytrading
@NoObiETrade909 Hi Jason, got both of your emails, thanks! I'll reply there shortly. The next update brings what you asked for: horizontal lines from your NinjaTrader charts and indicator levels like Order Flow VWAP in the DOM.
Aug 1, 2012: one of 8 servers missed an update. A reused flag woke old code. 212 orders became 4M+ executions in ~45 min. Unwinding the positions cost about $460M. Today brokers and exchanges run risk checks and kill switches. (SEC order; education only) #orderflow#markets