Gratitude changes everything. Every new day is a gift, every breath is a blessing. Give thanks for life today--it's the foundation for every opportunity ahead. Stay grateful and keep moving forward.
📊 **Trade Smarter, Not Harder!**
The market doesn't reward people who chase price—it rewards those who wait for high-probability setups.
In this chart, price pulled back into a key Fibonacci retracement zone after a strong bullish move. Instead of buying at the top, patient traders waited for price to retrace before looking for confirmation.
**Key lessons from this setup:**
✅ Let the market come to your entry.
✅ Use Fibonacci as a guide, not a signal.
✅ Combine retracement levels with market structure and price action.
✅ Risk management is more important than predicting the market.
Every professional trader knows that **patience is a strategy**.
💬 **Question for you:**
If you were trading this setup, where would you enter?
🔹 50%
🔹 61.8%
🔹 70.5%
🔹 78.6%
Comment your answer and explain why. Let's learn from each other! 👇
📌 Follow **Charts Empire Trading Academy** for daily forex education, market analysis, and trading psychology tips.
#Forex #Trading #ForexEducation #SmartMoney #PriceAction #TechnicalAnalysis #Fibonacci #RiskManagement #ChartsEmpire #TradingAcademy #ForexTrader
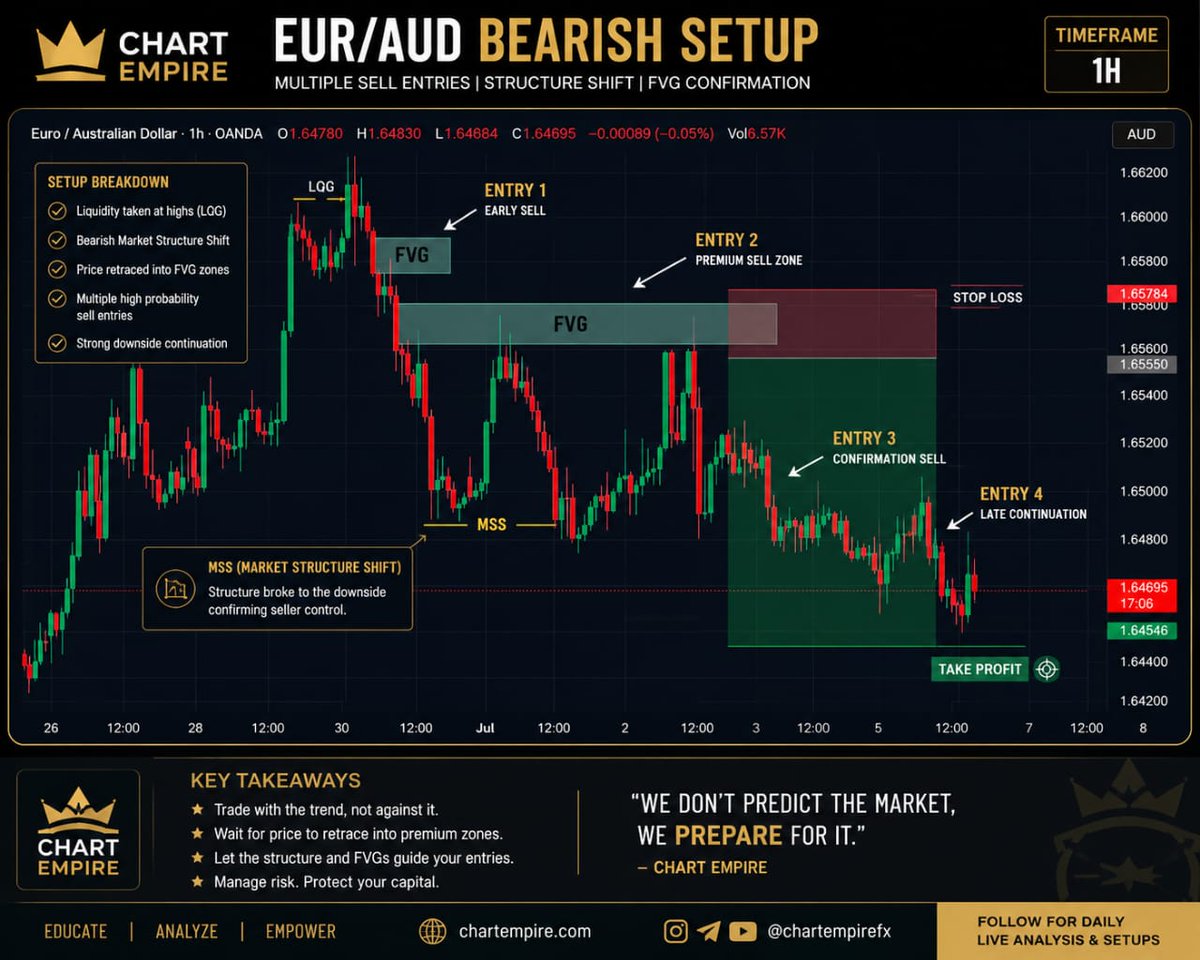
EUR/AUD 1H Sell Setup Summary
The analysis is showing a bearish market structure on EUR/AUD (1-hour timeframe), with the idea that price is likely to keep moving downward after retracing into areas of imbalance/FVG.
Main story of the chart
Price first pushed up and created a liquidity grab / lag near the top.
Entry explanation
The chart gives 4 possible entries, all based on the same bearish bias:
Entry 1
Early sell entry from the first FVG after the initial rejection.
More aggressive entry.
Good if you wanted to catch the move early.
Entry 2
Cleaner sell entry from the larger FVG retracement zone.
This is likely the main premium sell area.
Best entry for traders waiting for price to retrace before selling.
Entry 3
Confirmation-style entry after price starts reacting lower from the bearish zone.
Safer than entry 1 and 2 because bearish continuation is already showing.
Entry 4
Late continuation entry after price keeps respecting the downtrend.
Lower risk of entering too early, but reward is smaller because part of the move has already happened.
Risk-to-reward idea
The big red/green trade box shows the overall trade plan:
Red zone = stop loss area
Green zone = take profit area
The setup is aiming for a continuation sell after retracement into the FVG
#ForexTrading #TechnicalAnalysis #TradingView #ChartsEmpire #PriceAction #ForexEducation
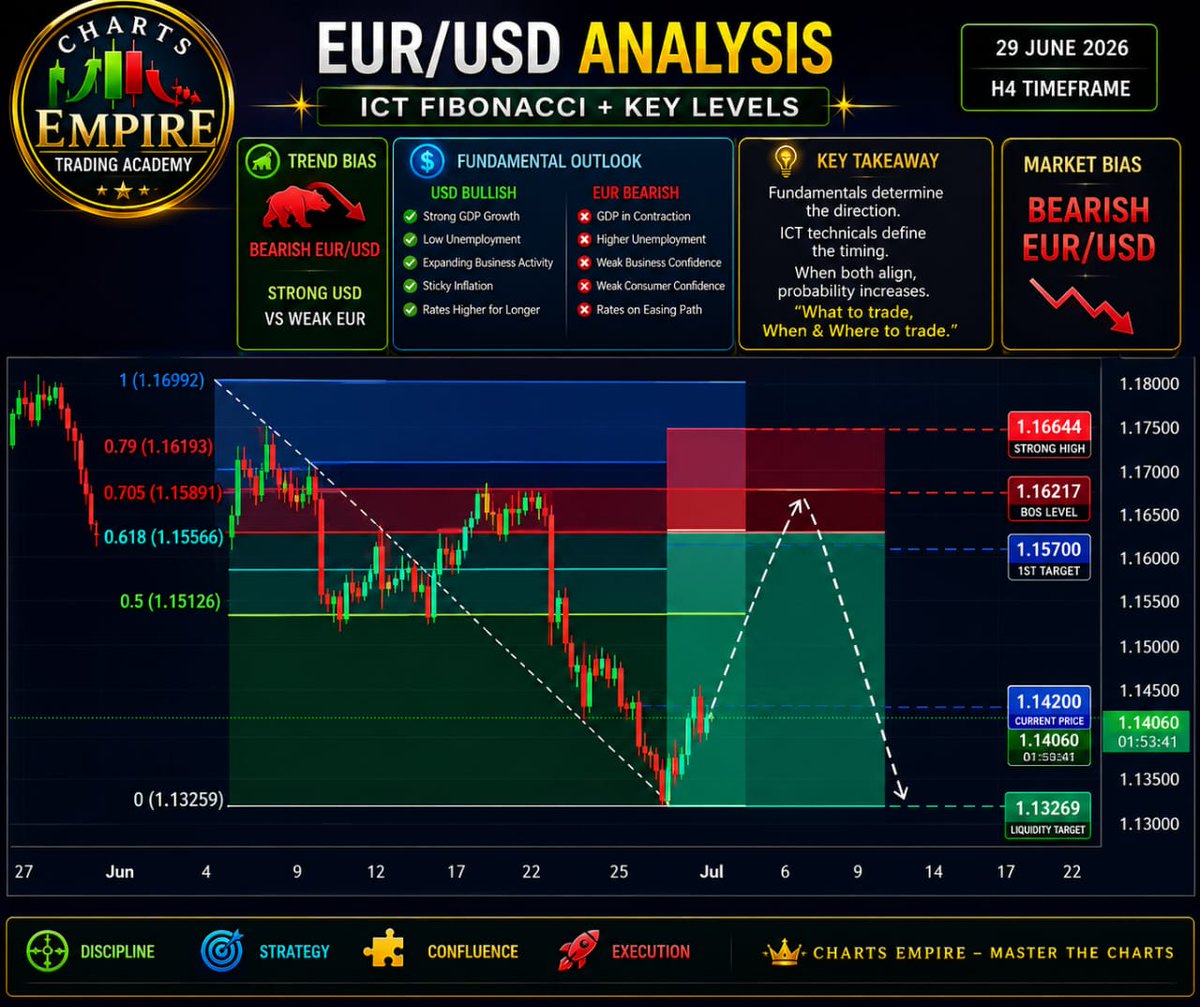
EUR/USD Analysis: ICT Fibonacci + Fundamentals
The macroeconomic outlook favored a strong U.S. dollar due to solid GDP growth, low unemployment, expanding business activity, and persistent inflation, while the Eurozone remained weak because of contracting GDP, higher unemployment, and weak business and consumer confidence. This established a bearish EUR/USD bias.
Using ICT concepts, the Fibonacci retracement was drawn from the swing high to the swing low. Price retraced into the Optimal Trade Entry (OTE) zone (62%–79%), where sellers stepped back into the market and the downtrend resumed.
Key takeaway: Fundamentals determine the market direction, while ICT technical analysis provides the optimal entry. When both align, trade setups generally have a higher probability of success.
#ChartEmpire #EURUSD #ForexTrading #ForexSignals #PriceAction #FibonacciRetracement #ForexEducation #TradingCommunity #Forex #CurrencyTrading #TechnicalAnalysis #DayTrading
EUR/USD Analysis: ICT Fibonacci + Fundamentals
The macroeconomic outlook favored a strong U.S. dollar due to solid GDP growth, low unemployment, expanding business activity, and persistent inflation, while the Eurozone remained weak because of contracting GDP, higher unemployment, and weak business and consumer confidence. This established a bearish EUR/USD bias.
Using ICT concepts, the Fibonacci retracement was drawn from the swing high to the swing low. Price retraced into the Optimal Trade Entry (OTE) zone (62%–79%), where sellers stepped back into the market and the downtrend resumed.
Key takeaway: Fundamentals determine the market direction, while ICT technical analysis provides the optimal entry. When both align, trade setups generally have a higher probability of success.
#ChartEmpire #EURUSD #ForexTrading #ForexSignals #PriceAction #FibonacciRetracement #ForexEducation #TradingCommunity #Forex #CurrencyTrading #TechnicalAnalysis #DayTrading