We often get asked about why we are called One2N well, here’s @chinmay185 & @jdk2588 sharing the story.
Our mission: help you go from 1 to N, wherever you need scale. Watch the video to hear it straight from the founders!
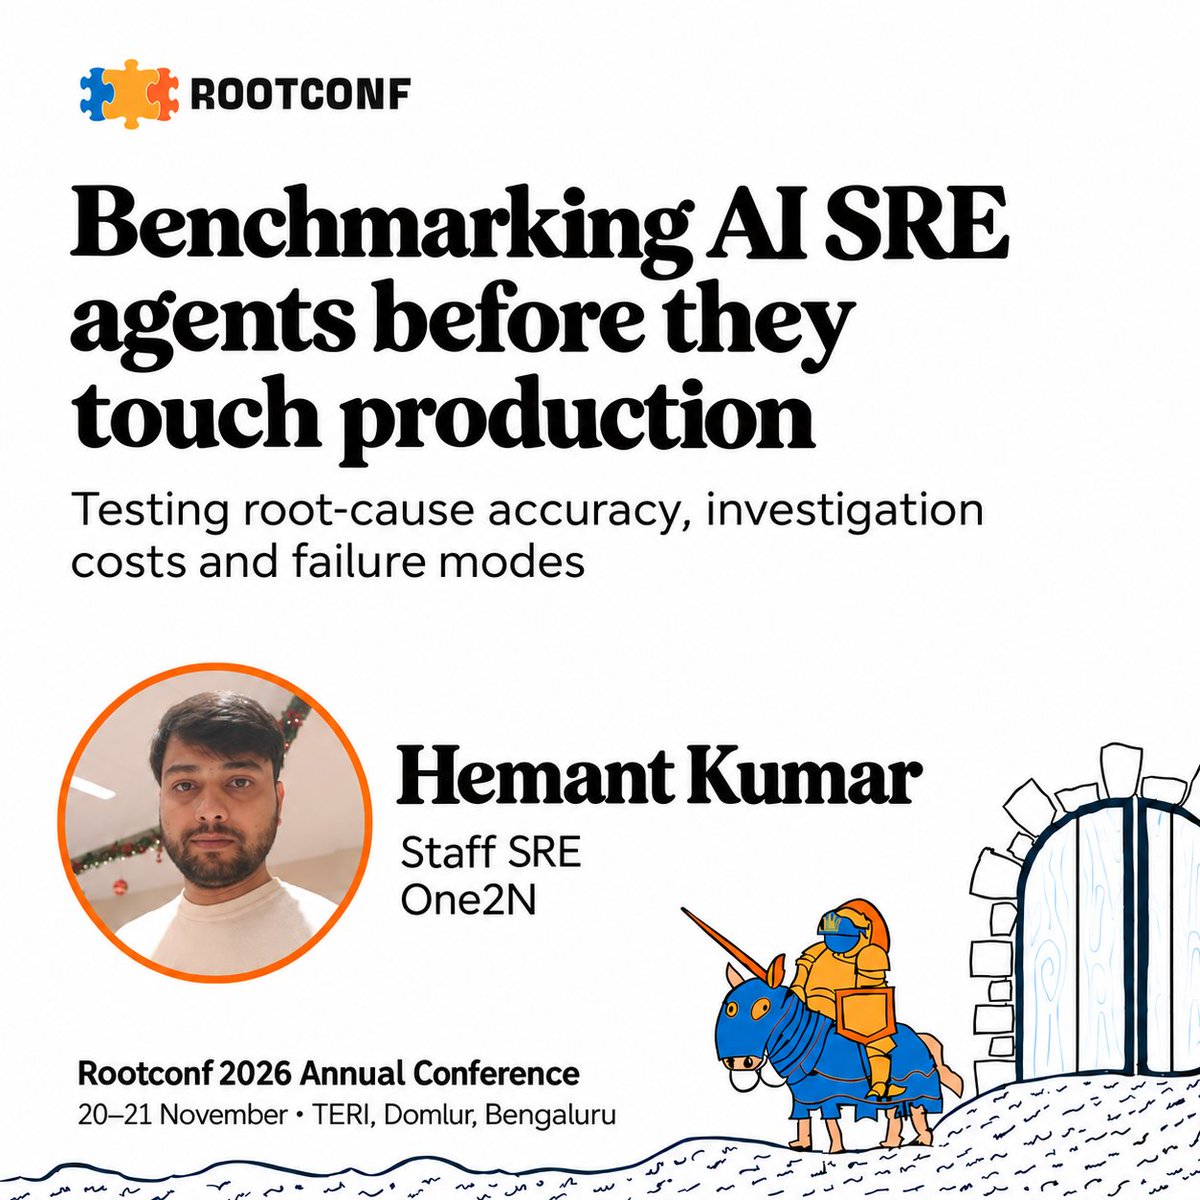
Hemant, staff SRE at One2N - would presenting at the Annual Rootconf 2026 , 20-21st November.
Looking forward to meet all of you there!
Bring your questions on
> agent evals
> benchmarking and
> inference
See you 🙌
What has changed in how we evaluate AI SRE agents?
IDE and CLI agents can already investigate production issues with the right MCP and SSO credentials.
And would you still pay for a dedicated SRE agent different?
Our latest blog explores the evolving evaluation criteria that One2N abides by:
> investigation context,
> organisational knowledge,
> auditability and operator safety.
Read more here and let us know what you think:
https://t.co/ii400rBZP8
#aiagents #ai #sre #aisre
On 21 Oct, LiteLLM 1.107.0 shipped with a credential stealer. Pin your gateway version like you pin a database.
Add it early, while there is one app and one key to move. Later, every team has its own path to each provider.
#AIObservability#OpenTelemetry#SRE
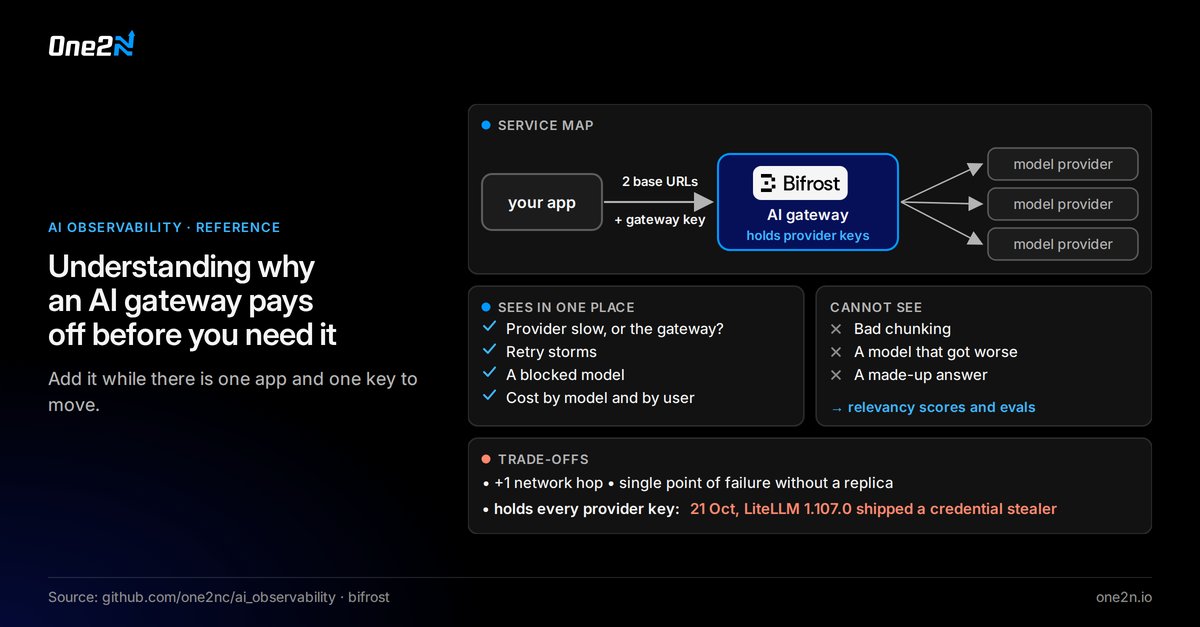
Understanding why an AI gateway pays off before you need it
An AI gateway sits between your app and the model providers. Every model call goes through it. In our Bifrost experiment, the app change was two base URLs (chat and embeddings) and one gateway key.
What you see in one place:
• Is the provider slow, or the gateway?
• Retry storms
• A blocked model
• Cost by model, and by user if the app sends a user ID
What it cannot see: bad chunking, a model that got worse, or a made-up answer. Those need relevancy scores and evals (parts 3 and 5).
The trade-offs:
• One more network hop on every call
• One more service to run, and a single point of failure without a replica
• Concentrating the provider keys is also the catch: the gateway holds all of them, so it is the one thing you must protect.
A fintech cut its analytics bill from $13,000 to $4,000 a month: AWS Glue and Athena to self-hosted ClickHouse, one layer at a time. p95 query latency 4.2 s, on par with Athena.
When you leave managed services, you own the monitoring. OpenTelemetry and Last9 went in on day one.
https://t.co/nAN95wqrFd
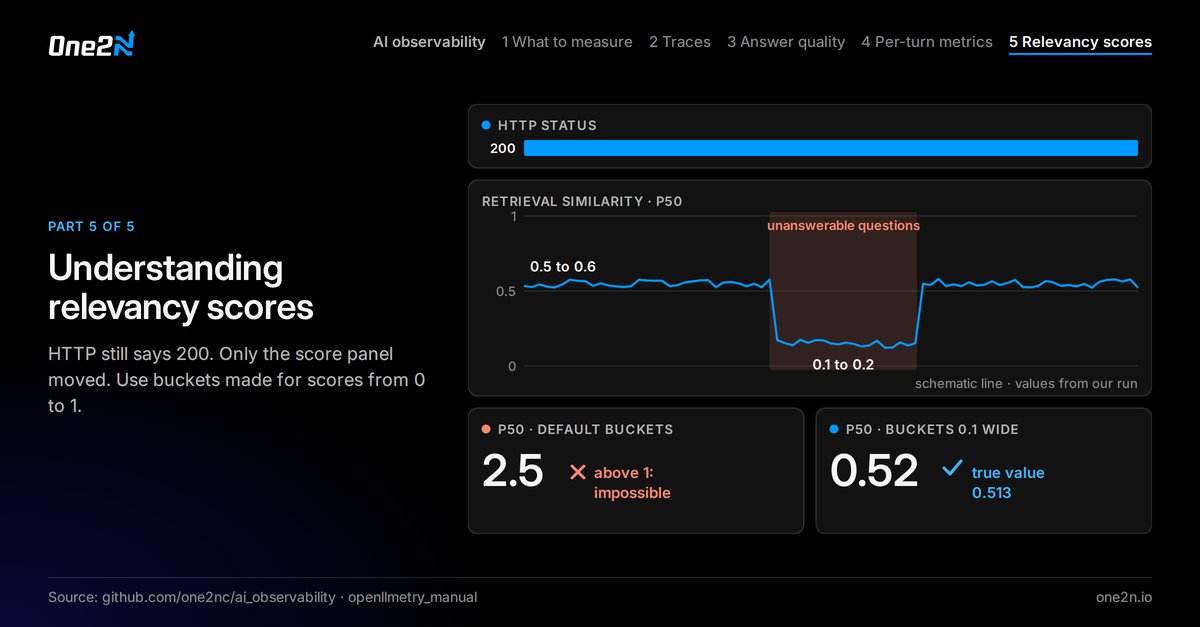
With explicit buckets 0.1 wide, the p50 was 0.52.
The trade-off: every bucket is one more time series for each label combination. Choose boundaries for the range you alert on, not the widest range you can think of.
#AIObservability#OpenTelemetry#SRE
Part 5 of 5 - Understanding relevancy scores, and why histogram basics still matter
In part 1 we asked: did the bot pull documents that fit the question? A relevancy score answers that. When the bot searches its documents, each match gets a similarity score from 0 to 1. Higher is closer to the question.
So you record the score as a histogram and watch its p50. Here an old lesson returns. The previous histogram quiz: the default OpenTelemetry buckets are made for milliseconds - 0, 5, 10, 25.
Every score lands in the first bucket, and the p50 comes out as 2.5. A score can never be above 1.
Rule: a percentile only sees a tail bigger than its cutoff. Pick one whose cutoff is under the share of users you care about. Slowest 2%? Use p99, not p95.
LLM tails are wider (50 vs 2,000 tokens, 1 vs 4 agent turns), so this bites harder. And a percentile is only as good as its histogram buckets: ms-scale buckets reported p50 2.5 on scores that never exceed 1.
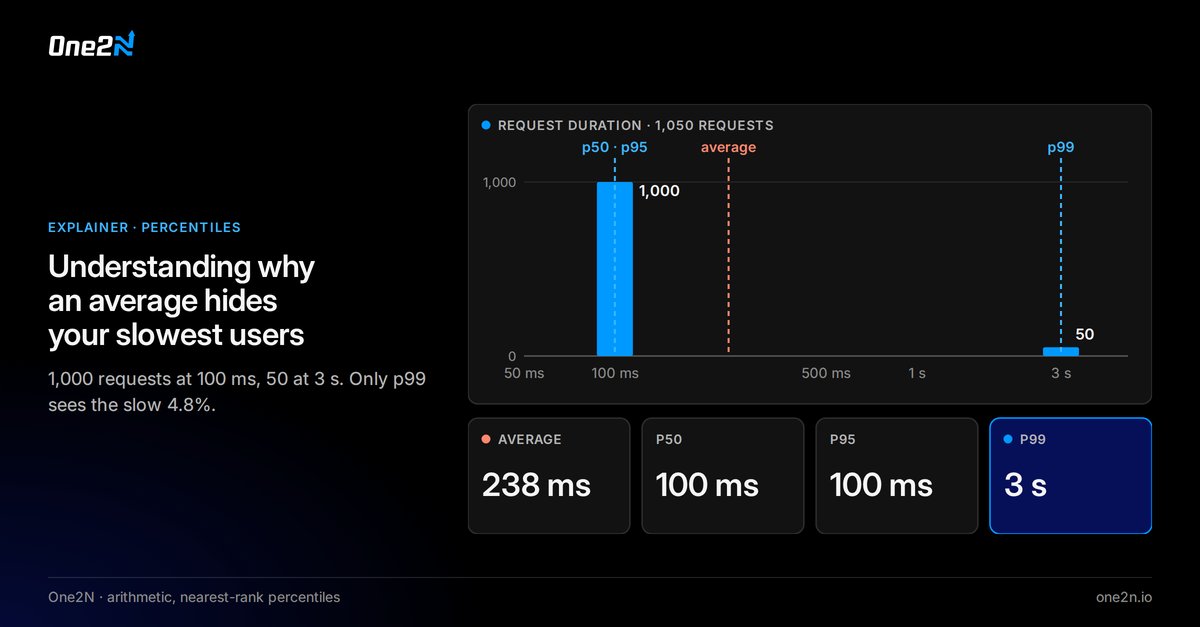
Why an average hides your slowest users:
1,050 requests: 1,000 at 100 ms, 50 at 3 s.
• Average: 238 ms (no request took 238 ms)
• p50: 100 ms
• p95: 100 ms
• p99: 3 s
pN drops the slowest (100-N)%. The slow tail is 4.8%, just under p95's 5% cutoff, so p95 steps over it and reads 100 ms. p99 drops only 1%, so the 3 s surfaces.
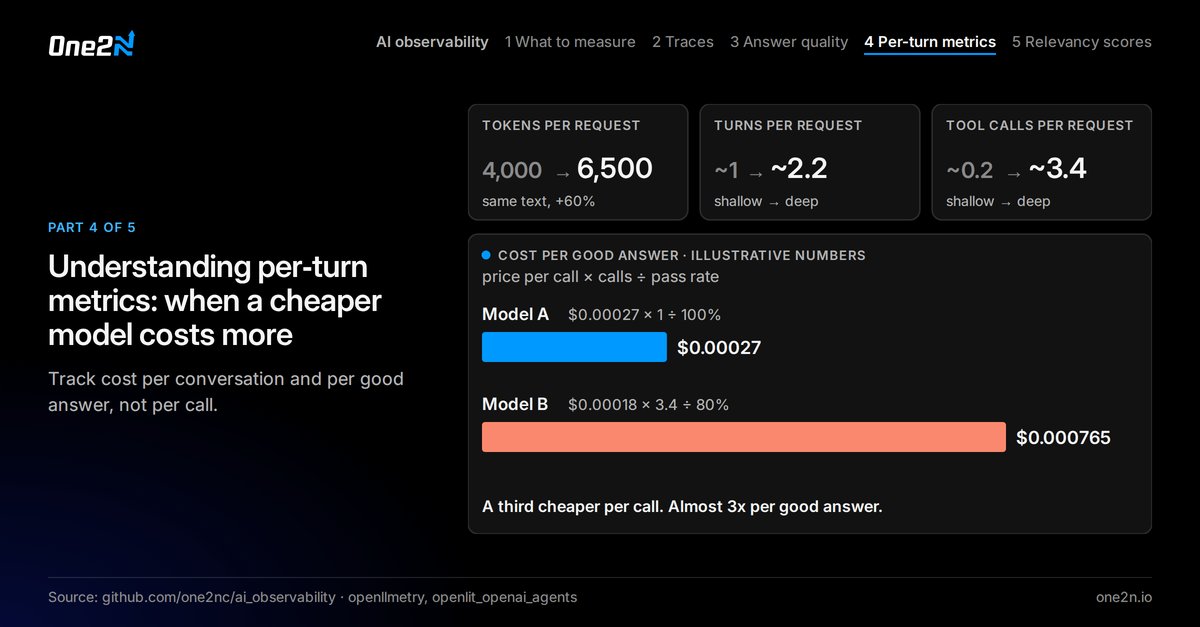
So track cost per conversation and per good answer, not per call.
Next: relevancy scores, and why histogram basics still matter.
#AIObservability#OpenTelemetry#SRE
Part 4 of 5 - Understanding per-turn metrics: when a cheaper model costs more
A model that is cheaper per call can end up almost 3x more expensive per good answer.
Worked example (illustrative numbers). Same question put to two models:
> Model A: $0.00027 per call, answers in 1 call. Cost per good answer: $0.00027.
> Model B: $0.00018 per call (cheaper), but takes 3.4 calls and passes only 80% of the time.
- 3.4 calls x $0.00018 = $0.000612 per attempt
- 1 in 5 attempts fails, so divide by 0.8: $0.000612 / 0.8 = $0.000765 per good answer
Result?
Model B costs $0.000765 vs Model A's $0.00027 per good answer. Almost 3x more, even though each call is cheaper.
Dropping an interesting old blog of ours where an ML service answered in under 2 seconds. Its users waited more than 20s for the response increasing the tail latency.
LLM systems have the same shape. Put a span or a metric on each step, both directions.
Read our article here by @chinmay185
https://t.co/hxoc8piubl