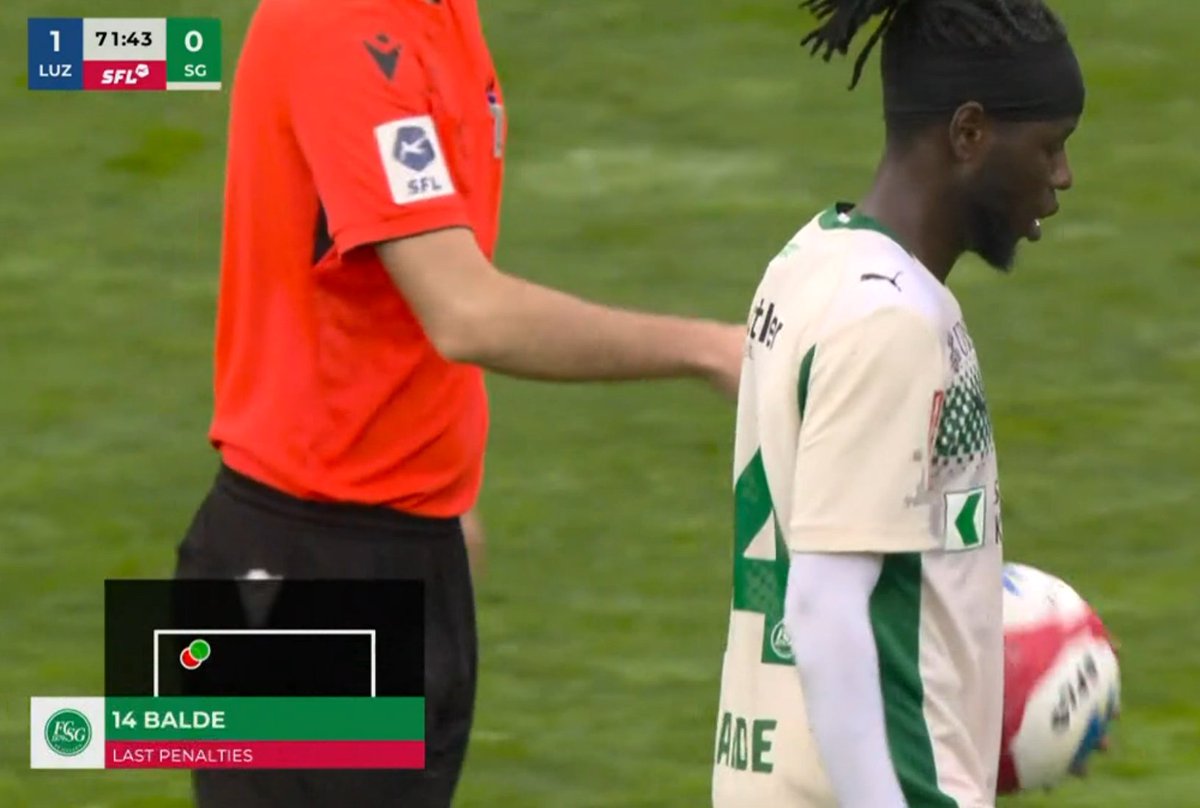
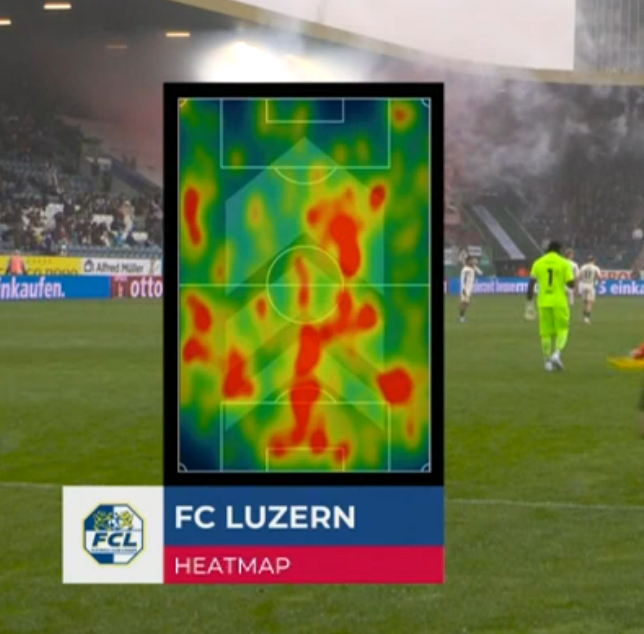
The Swiss Super League has rolled out a new suite of live broadcast graphics – powered by #Opta data.
The visuals bring greater clarity and depth to match coverage – helping to surface key moments and storylines as they happen.
See it in action. ⬇️
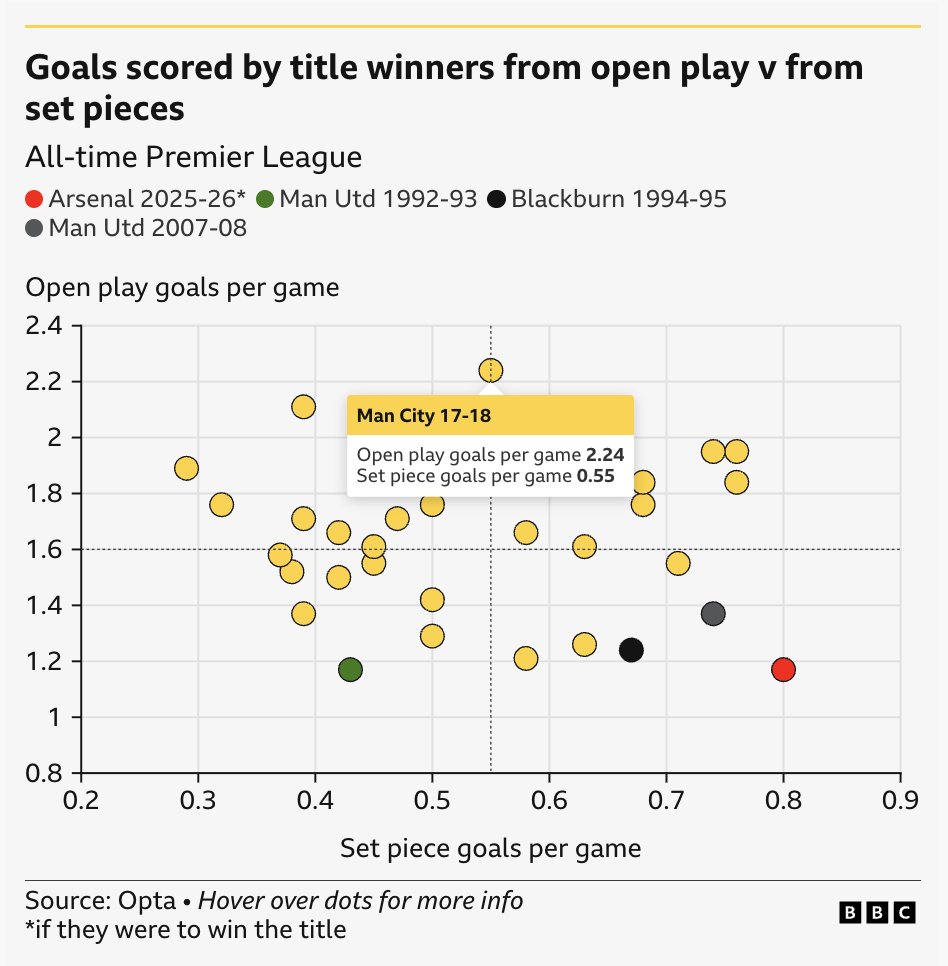
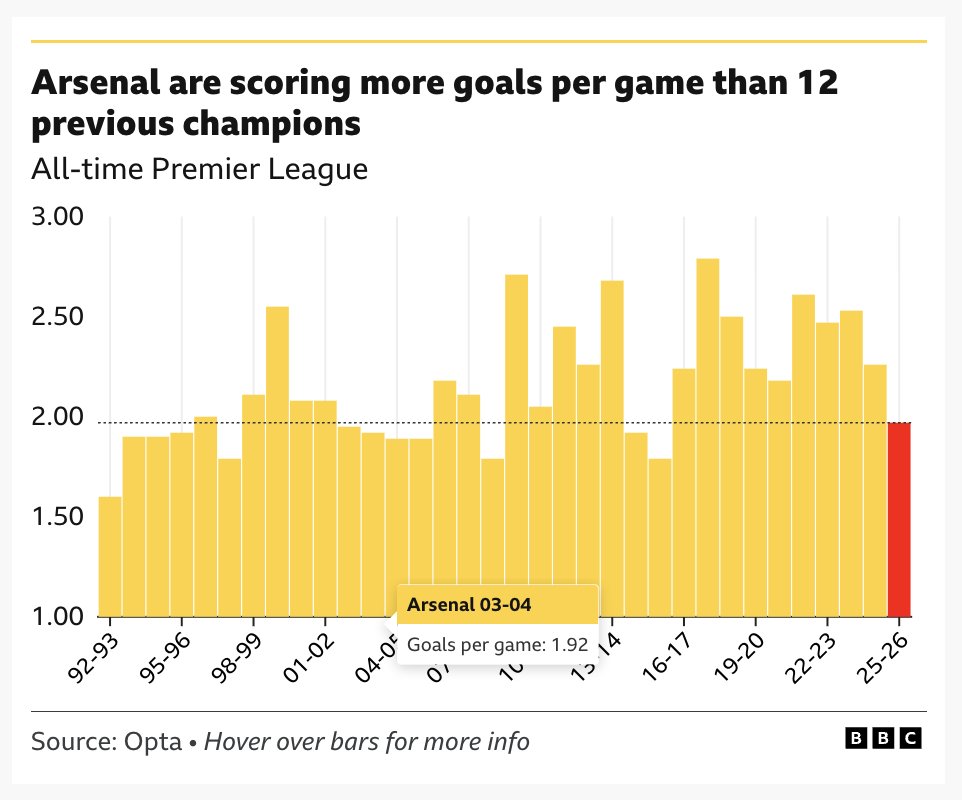
Would Arsenal be the ‘ugliest title winners’ in Premier League history?
@BBCSport uses #Opta data to put the debate into historical context as Mikel Arteta’s side chase their first league title since the 2003–04 season.
Read the full analysis ➡️ https://t.co/te77NDIMQ4
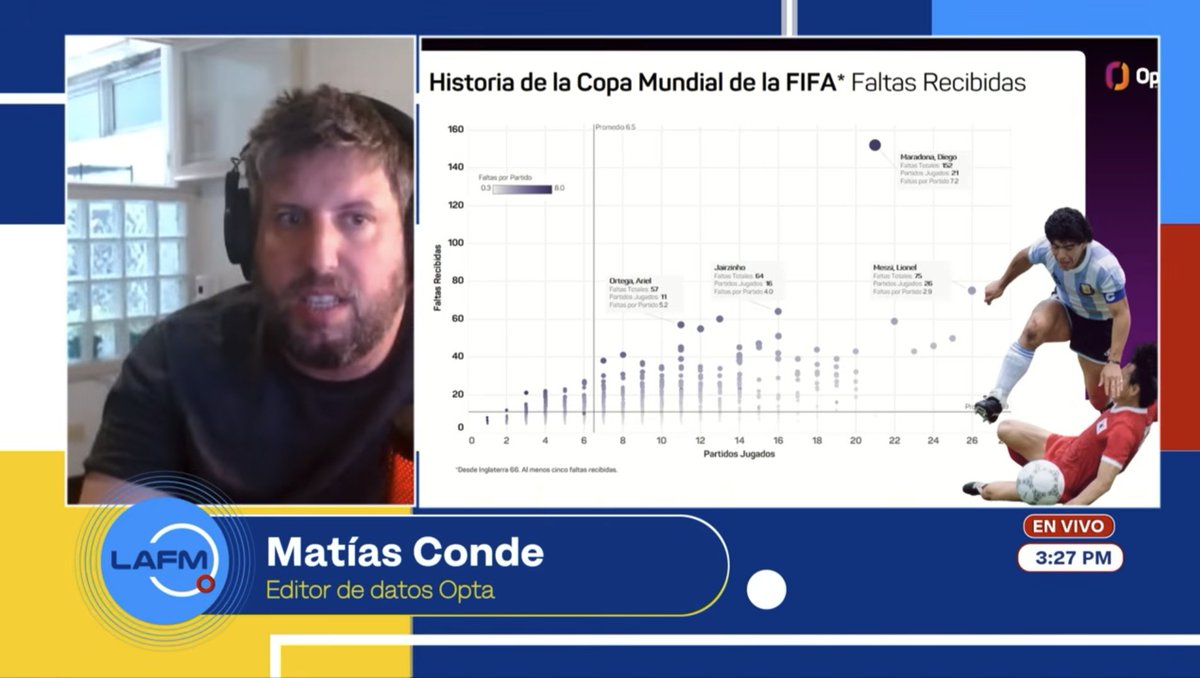
Diego Maradona and the evolution of fouls throughout #FIFAWorldCup history.
@mmcr85 joined @DeportesRCN to give an #Opta-led look at how foul patterns shifted over time, from heavy challenges Maradona faced to the way the modern game is officiated.
➡�� https://t.co/2YhTaNNQ2t
TryZone IQ has been shortlisted for three major industry awards.
Devised by @Capgemini and delivered in partnership with @WorldRugby and Stats Perform, the campaign was shortlisted in two categories at the #UKSA2026 and for the AI in Sport Award at the @SportIndustry Awards.
A 2,529-mile trip to Baku sees @NUFC face @FKQarabagh tonight – the longest distance an English side has ever covered in #UCL play.
🌍 To put that into context, @OptaAnalyst built out an interactive map comparing this matchup with other journeys throughout the competition's history – showing just how extreme Newcastle's route to Azerbaijan really is.
A data-led look at travel demands, historical comparisons and what this record-breaking journey means ahead of a decisive night ➡️ https://t.co/o1beziaL2p
Read both of @ASMexico's articles below.
🔗 Los 10 jugadores que mueven los hilos en ataque de Chivas y América – https://t.co/96fzD8ZW99
🔗 Milito vs Jardine: Dos estilos distintos chocan en el Clásico Nacional – https://t.co/LpcCBLX7yT
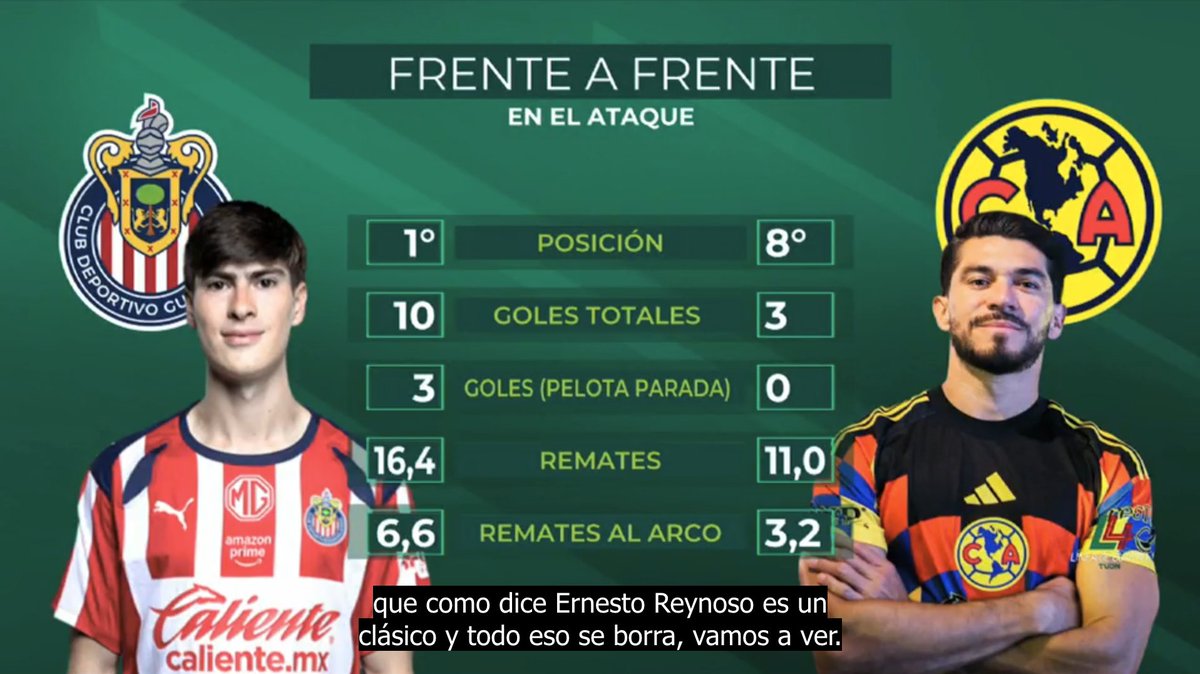
Powering storytelling in the build-up to El Clásico Nacional.
📰📺 Ahead of the latest #LigaMX showdown, the @OptaJorge team prepared a special #Opta data-filled report – helping shape @ASMexico and @TUDNMEX's Línea de 4 coverage.
Take a look. ⬇️
The Super Bowl is one of the largest live sporting moments of the year – and data plays a central role.
During #SBLX, @OptaSTATS worked alongside NBC and NFL Network, providing real-time stats for on-screen graphics, lower-thirds, and live commentary.
A thread. 🧵
Did @ManCity land the signing of the season?
📰 The @premierleague uses 𝙾𝚙𝚝𝚊 𝚅𝚒𝚜𝚒𝚘𝚗's Line-Breaking Passes to analyse Marc Guehi's impact – and how he’s developed into one of the league’s most complete defenders.
Take a look ➡️ https://t.co/3tvHZSyQA6
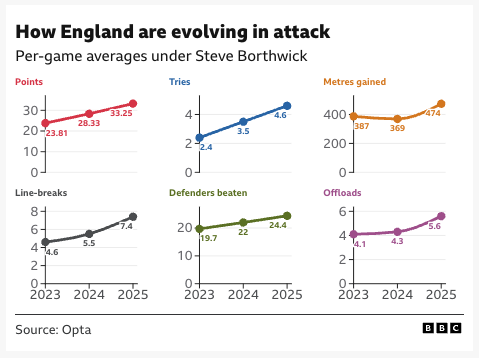
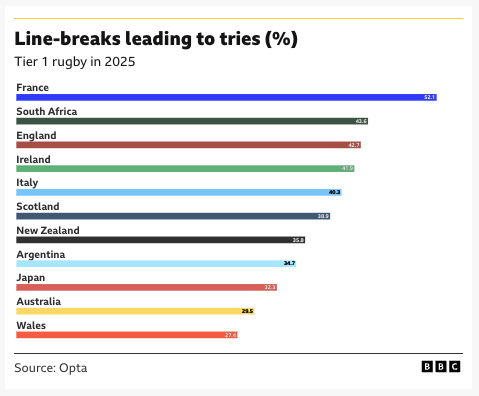
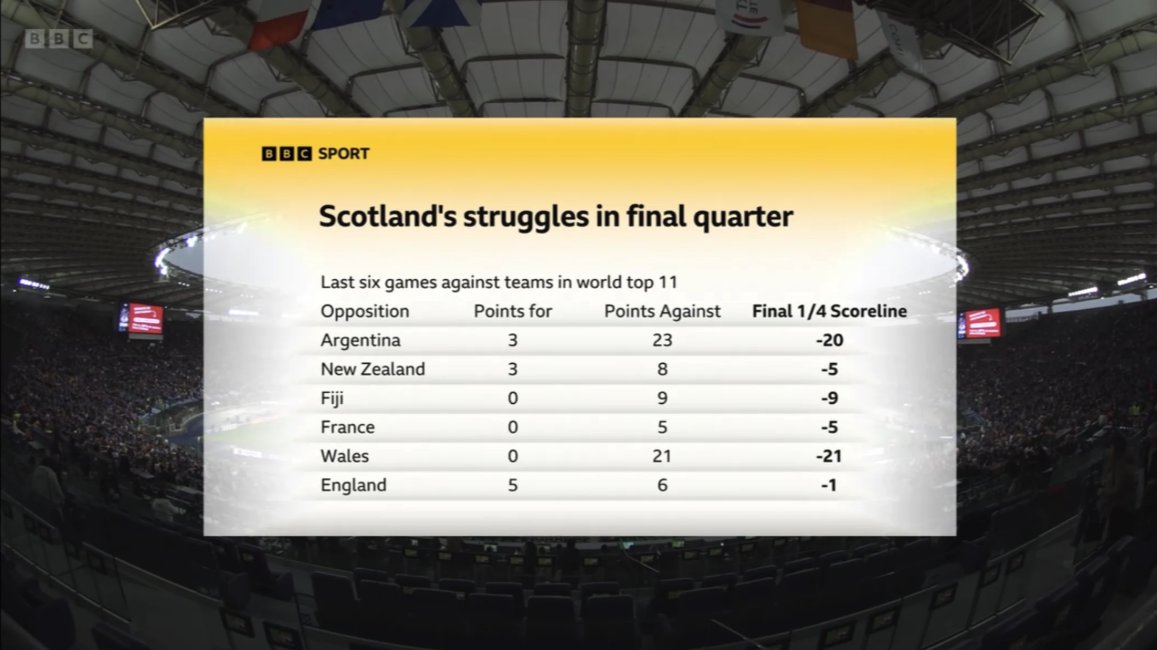
Three years ago, England were among the least effective attacking sides in Tier 1 rugby.
Now, they arrive at #GuinnessM6N on an 11-match winning run.
📰 @BBCSport uses #Opta data to examine Steve Borthwick’s impact and England's new-found ambition ➡️ https://t.co/pyjWZ7YhEk
Behind the scenes at Levi's Stadium. 🎤
The 𝙾𝚙𝚝𝚊 𝙲𝚘𝚗𝚝𝚎𝚗𝚝 𝙰𝚐𝚎𝚗𝚌𝚢 has been in Santa Clara all week for #SBLX – capturing stories, statistics and scenes from one of sport's biggest stages.
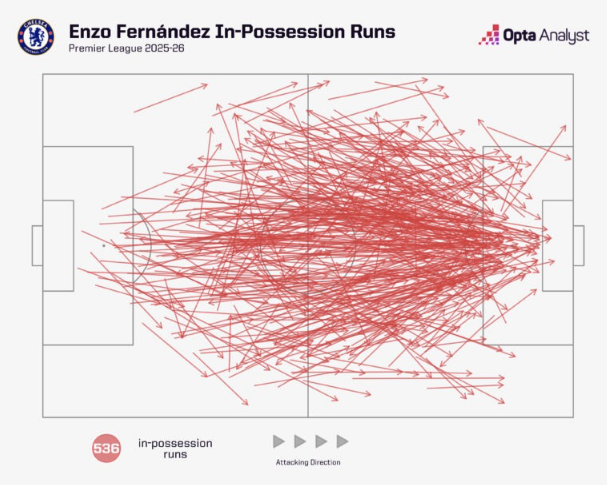
Enzo Fernández's late runs into the box are becoming a trademark of @ChelseaFC's attacking play.
Using 𝚡𝚃, @OptaAnalyst breaks down how the Argentine is driving more attacking impact through his movement than any other #PL player.
A data-led look ➡️ https://t.co/s1KbJWrxqw
How do Liverpool fix their struggles against low blocks?
📰 @BBCSport used #Opta data to break down how deep defences, set-piece issues and long passing have contributed to the Reds' domestic struggles.
Read the full analysis ➡️ https://t.co/WQsVI9zBB8
#Opta in action on a decisive night of #UCL football.
📸 From the build-up to the final whistle and post-match analysis, here are a few examples of how Opta data and insight supported coverage across Europe.
Lionel Messi’s impact on @MLS – as told by @diarioas.
This in-depth analysis uses #Opta data to examine how Messi has reshaped @InterMiamiCF and the wider league, pairing advanced metrics with rich visuals to bring his influence to life.
Check it out ➡️ https://t.co/0NuT6bduBa
What does xG predict for the rest of the #PL season?
@BBCSport combines #Opta data with interactive visuals to move beyond the league table and examine what the underlying numbers say about the title race, European qualification and relegation battle.
➡️ https://t.co/WiDMcF0TZ3
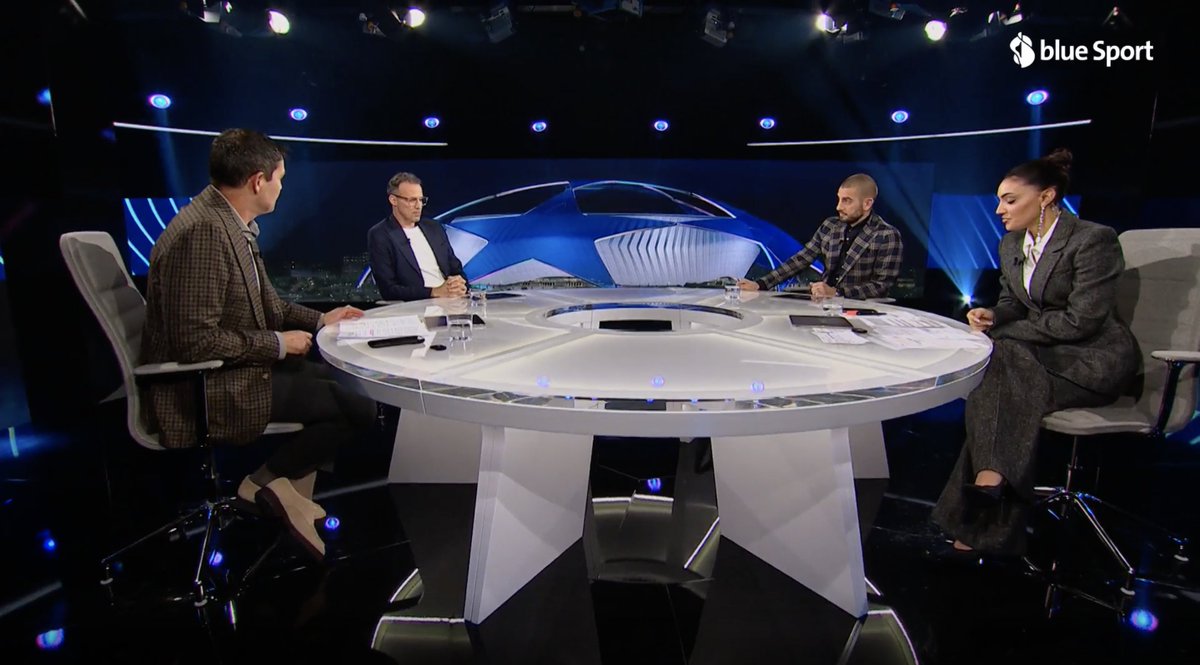
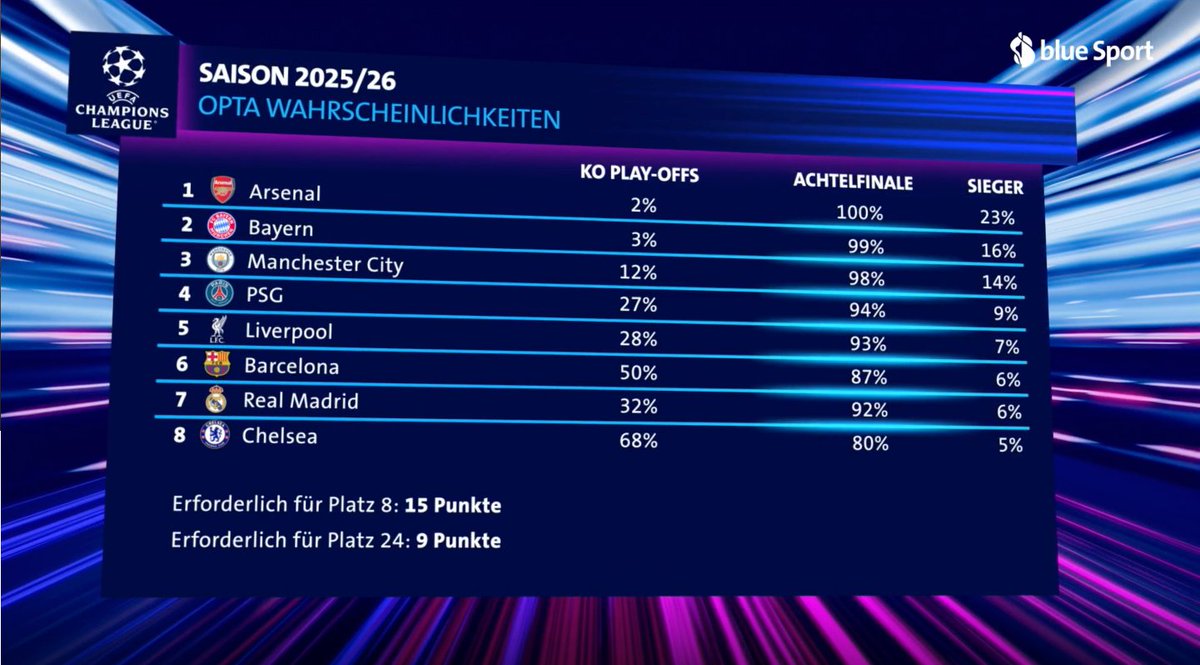
Putting 𝙾𝚙𝚝𝚊 𝙿𝚛𝚎𝚍𝚒𝚌𝚝𝚒𝚘𝚗𝚜 at the heart of blue's #UCL coverage.
The Swiss network integrated the supercomputer into their studio show, bringing clarity and context to the key storylines of a tightly contested competition.
Check it out. ⬇️
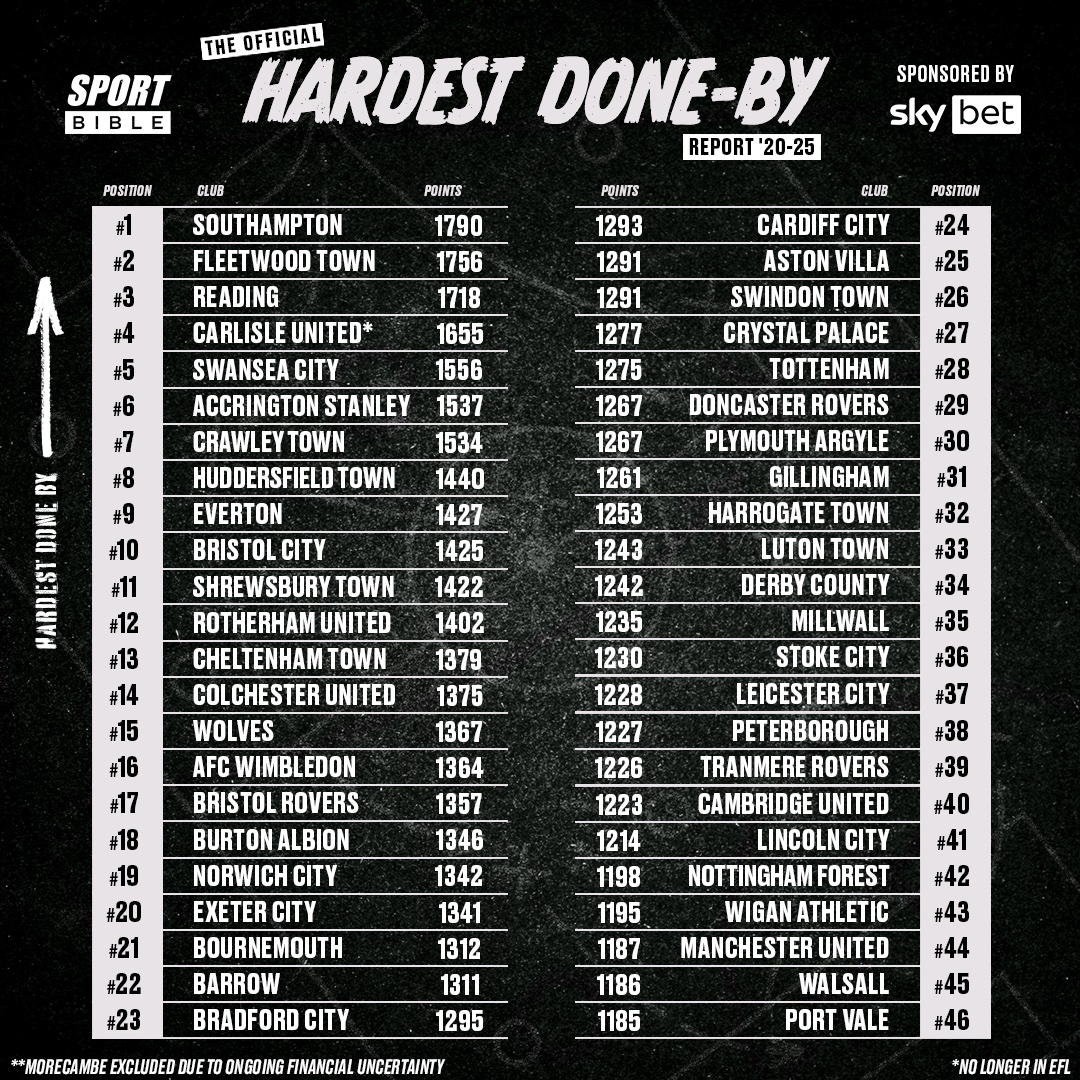
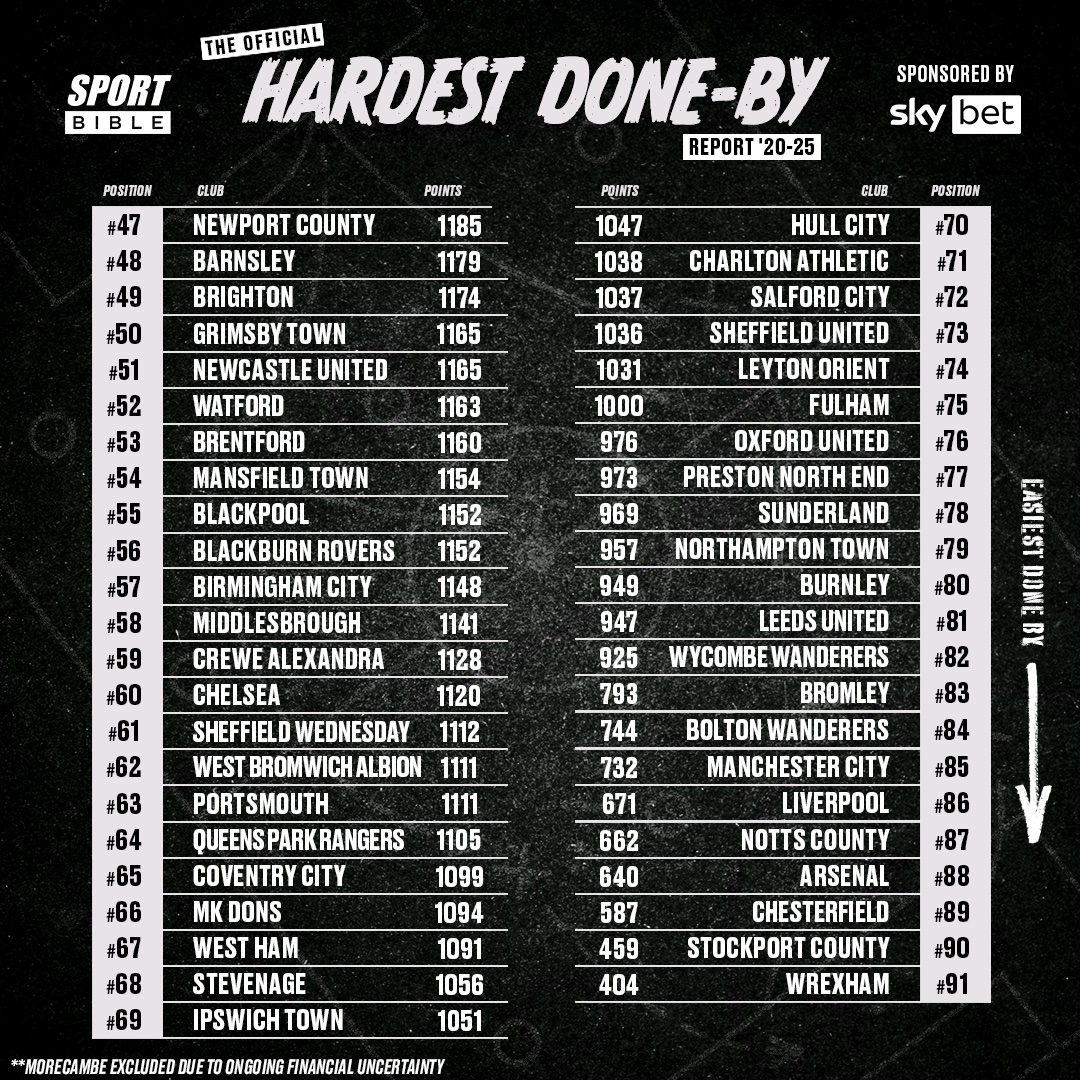
Every fan thinks their club is the hardest done by.
Now there’s data to prove who’s truly had it worst.
Using 13 #Opta-powered metrics, @sportbible and @SkyBet ranked every team across English football to reveal which fanbases have suffered the most.
➡️ https://t.co/RptLZsB4xf