A search engine for market history.
Find similar past market setups across 30+ years of price, macro, vol, and see what happended next. Try ORION free below ↓
How did this setup play out last time?
Every position starts with that question. Answering it properly takes hours, so most people answer it from memory instead.
Here's forty seconds of what the answer looks like when it's measured with the Orion Engine.
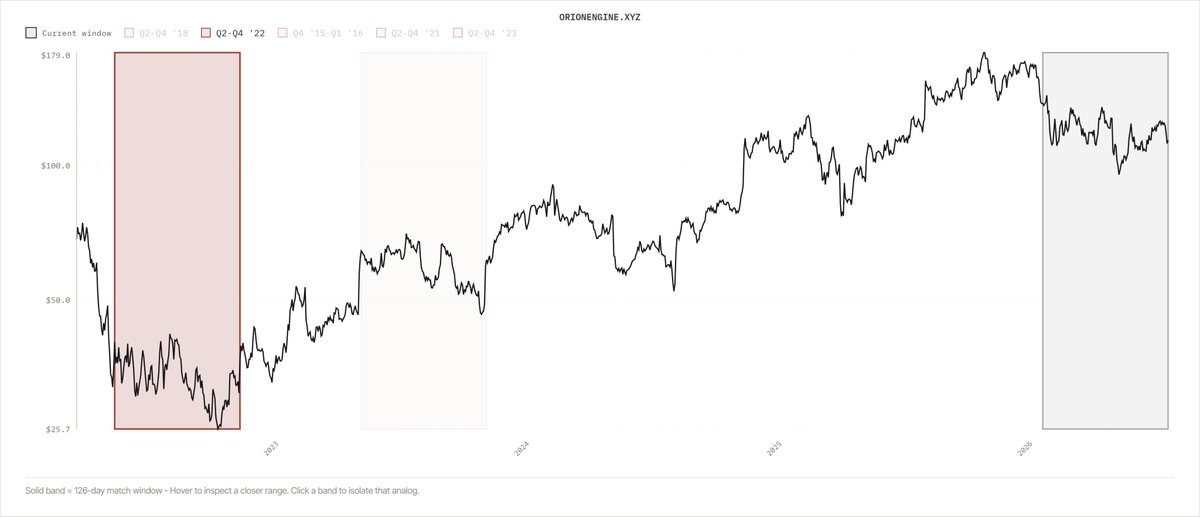
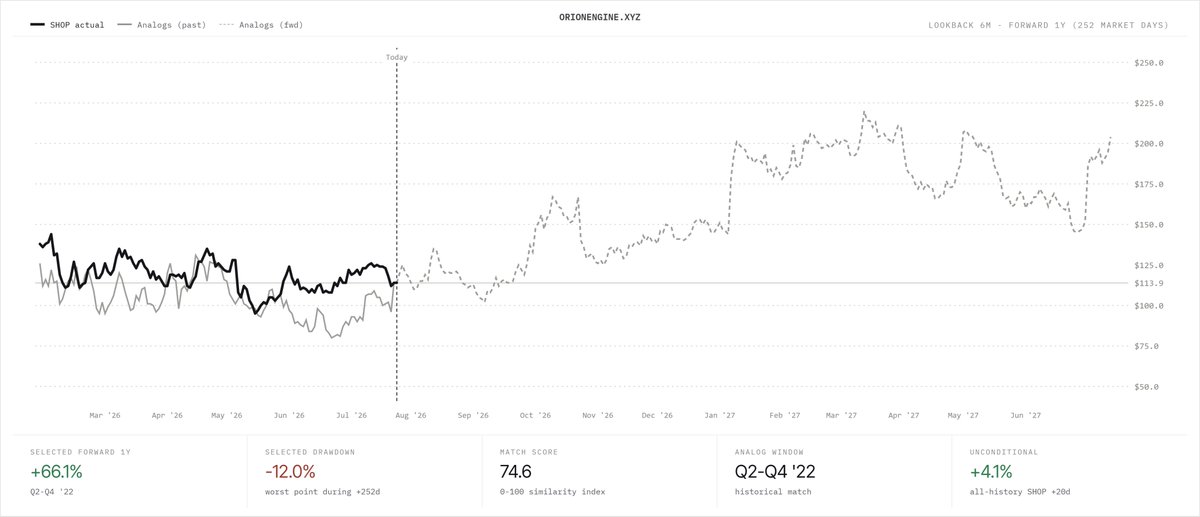
Historical, Overlay, Macro, Outcomes, Correlations, Conditions, Seasonality... All these tools are available instantly to test for when and how a setup last played out.
https://t.co/Ew3w5pymQl
.@cantonmeow this is your kind of jam
$BTC could be #Nvidiaing (similar to $NVDA in Q3' 2017 - Q3' 2019)
Engine found this automatically in Cross-ticker view.
#OrionEngine
.@cantonmeow this is your kind of jam
$BTC could be #Nvidiaing (similar to $NVDA in Q3' 2017 - Q3' 2019)
Engine found this automatically in Cross-ticker view.
#OrionEngine
@GeoMetric_9 Thanks Geo appreciate your support from early on. The macro backdrop was one of the first things added! Very important to take into consideration when making historical comparisons.
How did this setup play out last time?
Every position starts with that question. Answering it properly takes hours, so most people answer it from memory instead.
Here's forty seconds of what the answer looks like when it's measured with the Orion Engine.
Historical, Overlay, Macro, Outcomes, Correlations, Conditions, Seasonality... All these tools are available instantly to test for when and how a setup last played out.
https://t.co/Ew3w5pymQl
Great find by @colin_gladman! In fact, when searching for similar historical ranges for the past two months of price action, I noticed that most of times, the sweep always happens right before the reversal.
You can see it pretty clearly in the historical view below.
$QQQ outlook for the next 6M based on what's happended YTD.
A fake breakdown of this range very shortly (early next week), followed by a strong rally up until mid to late september, some more downside and volatility into mid-terms, and a steady grind higher afterwards.
$QQQ outlook for the next 6M based on what's happended YTD.
A fake breakdown of this range very shortly (early next week), followed by a strong rally up until mid to late september, some more downside and volatility into mid-terms, and a steady grind higher afterwards.
@DeepInference Yep think too many people converging on these too. Rate hike expectations next week massively overblown. $QQQ fake range breakdown before reversal is historically bullish https://t.co/CWlsYQHAkO
Great find by @colin_gladman! In fact, when searching for similar historical ranges for the past two months of price action, I noticed that most of times, the sweep always happens right before the reversal.
You can see it pretty clearly in the historical view below.
Great find by @colin_gladman! In fact, when searching for similar historical ranges for the past two months of price action, I noticed that most of times, the sweep always happens right before the reversal.
You can see it pretty clearly in the historical view below.
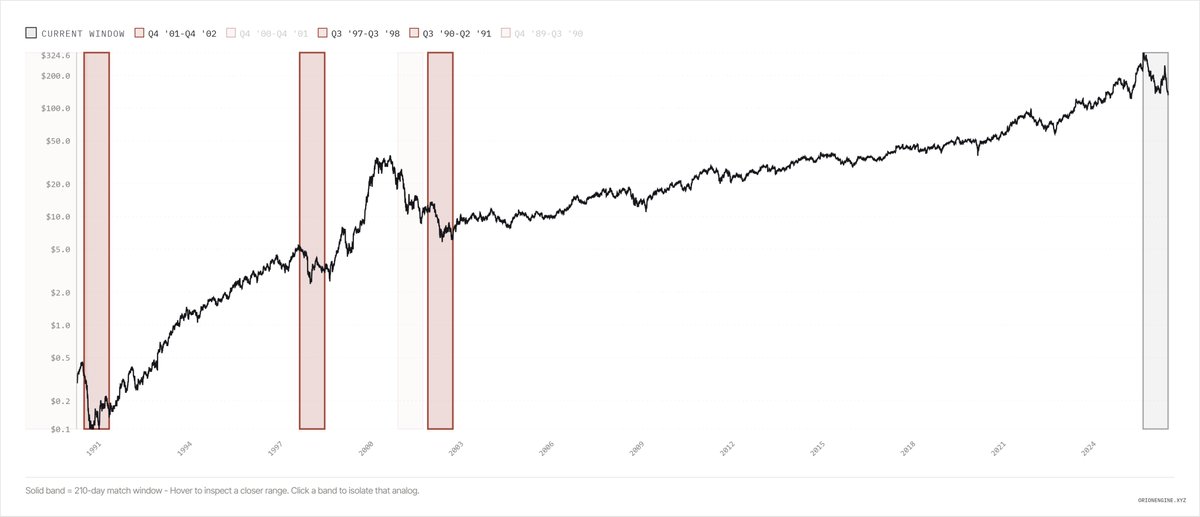
$ORCL not the time to be bearish historically speaking.
While the price action has been nasty for the past year, it is also the same price action that usually preceded the big runs in the stock like in 1990, 1998 and 2002.
There's no AI boom without ORCL... @Globalflows
Remember that $QQQ sweeping the range lows is not necessarily bearish like everyone is saying today calling for a further 10% drop.
While possible, historically this kind of situation happended right before the reversal and new uptrend into ATHs within weeks.
Study history!
Great find by @colin_gladman! In fact, when searching for similar historical ranges for the past two months of price action, I noticed that most of times, the sweep always happens right before the reversal.
You can see it pretty clearly in the historical view below.
$SLV #Silver has followed since early March (back when it was $80/oz) the engine's forecast of a downtrend and consolidation well below ATHs, now sitting at 59$.
This has been consistent with every Silver blow-off top, and historically, after it has gone down the way it has, a relief rally up to at least $75/oz would be pretty standard at this point.
But I still wouldn't be betting on a new Silver ATH at all this year or even next year. The post blow-off top consolidation historically lasts a couple of years at least.
Below you'll find the current Silver price action overlaid with the closest historical analogs, and how today would play out if we keep tracking them.
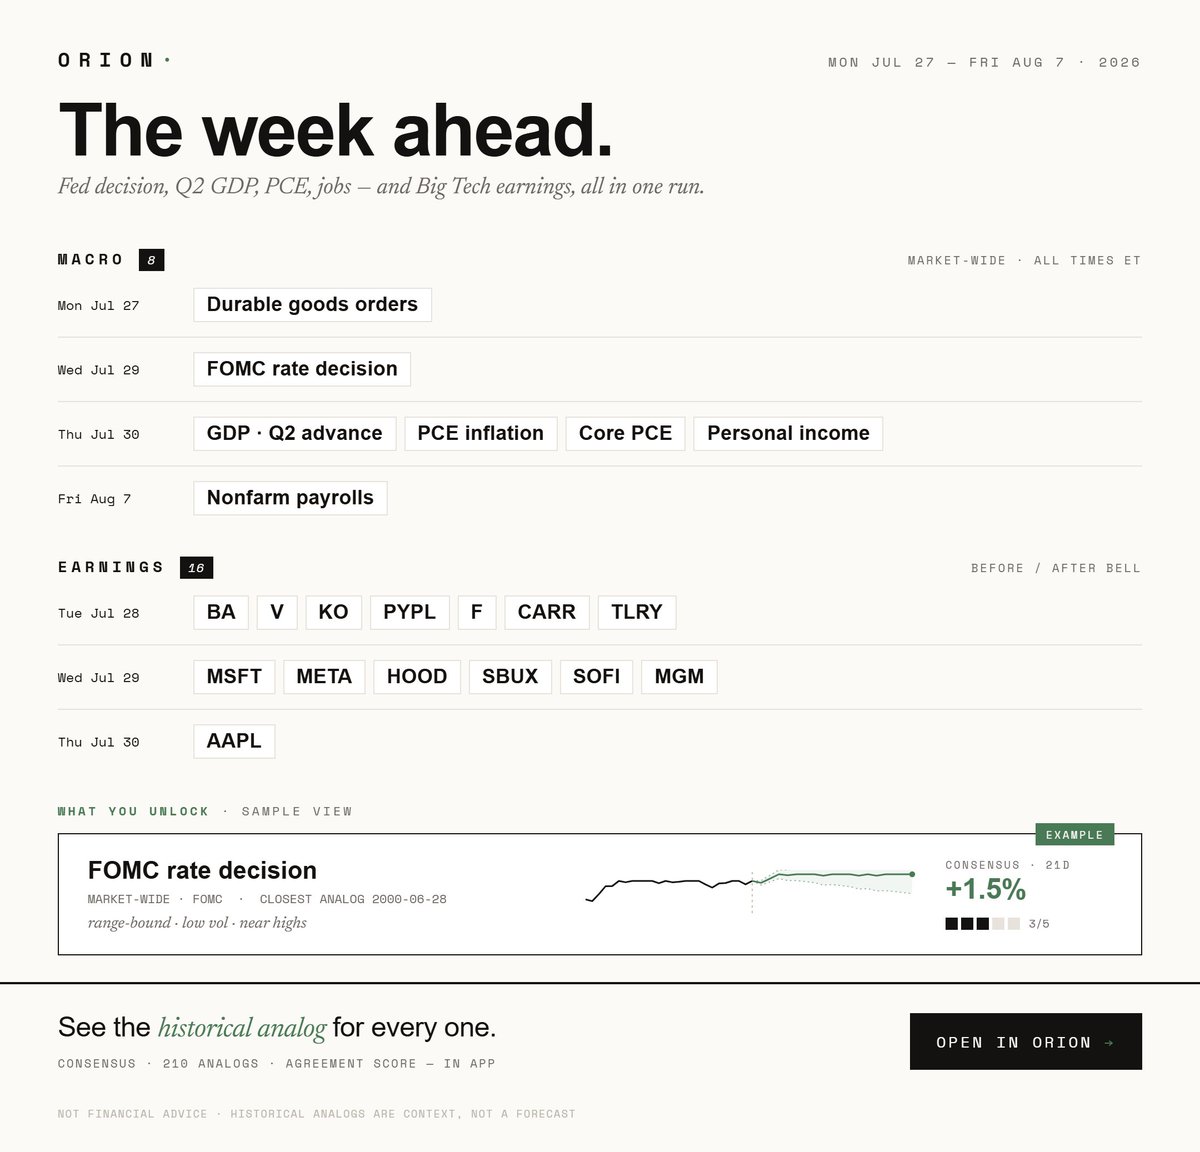
Next week is genuinely one of the most stacked in terms of Events.
Earnings on mega caps, high-beta names, airlines, as well as FOMC, GDP, and PCE releases.
Head over to https://t.co/bCNbosUeL5 to visualize for each Event how historically similar lead-ups played out after.