⚠️ My only official X account is @PatrickCiummoCS
I will never DM you first, sell anything, or ask for funds. Any account claiming to be me and doing so is an impersonator. Please report it.
For a deeper dive on $ABNB, here's the full segment from this morning.
Tap the card to play.
@SchwabNetwork@SchwabTrading#SchwabCoaching
Tickers mentioned are for illustrative purposes only and not a recommendation.
https://t.co/jPvmOyW1nL
$BOT finished last week at its all-time low, down 69% from its 59.00 high in the six months since its May IPO. Will it be worth monitoring into the new week?
@SchwabNetwork@SchwabTrading#SchwabCoaching#TOSMobile
1Y:1D charts are for illustrative purposes only and not a recommendation.
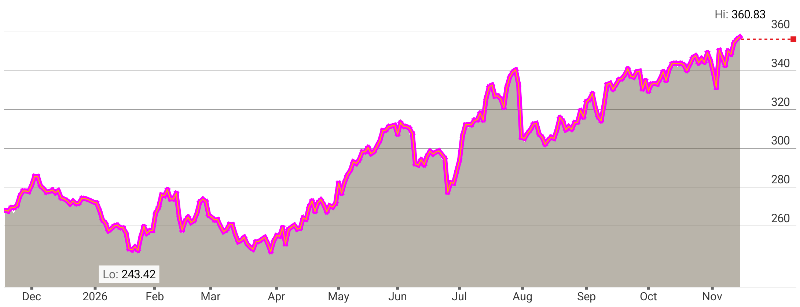
$JNJ finished last week within 0.2% of its 52-week high, up 46% over the past year with a beta of just 0.20. Will it be worth monitoring into the new week?
@SchwabNetwork@SchwabTrading#SchwabCoaching#TOSMobile
1Y:1D charts are for illustrative purposes only and not a recommendation.
$AAPL finished last week within 1% of its 52-week high, with more than 5.6 million contracts of total options open interest. Will it be worth monitoring into the new week?
@SchwabNetwork@SchwabTrading#SchwabCoaching#TOSMobile
1Y:1D charts are for illustrative purposes only and not a recommendation.
Asked to break down $ABNB on Morning Movers @SchwabNetwork. Its earnings gap ran to 197.87, and the pullback held near 180. Now back above the 5-day, pink earnings VWAP and red VWAP. Clearing the blue line at 187.50 could resume a run toward its all-time high.
@SchwabTrading #SchwabCoaching #TOSMobile
20D:30m charts are for illustrative purposes only and not a recommendation.
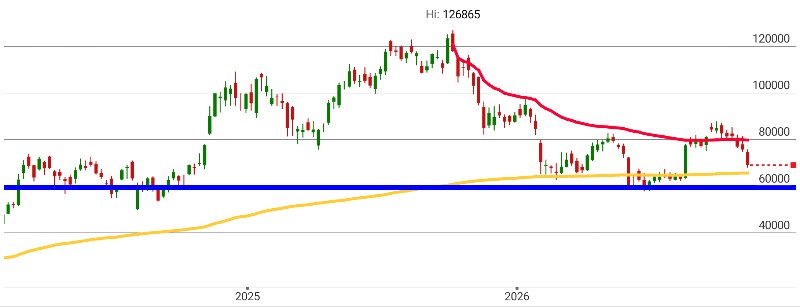
Late night $BTC is slipping toward the gold VWAP near 64,000, anchored to its largest volume week dating back to 2018. That, coupled with the blue line near 60,000, gives two potential levels of support.
@SchwabNetwork@SchwabTrading#SchwabCoaching#TOSMobile#Bitcoin Max:W charts are for illustrative purposes only and not a recommendation.
$BTC has pushed further from the red VWAP off the all-time high. Next logical support: the blue line near 60,000 and the gold VWAP near 66,600, anchored to the largest volume week since 2018. I added volume so you can see the spike it's anchored to.
@SchwabNetwork@SchwabTrading #SchwabCoaching #TOSMobile
$BTC Max:W charts are for illustrative purposes only and not a recommendation.
A 10% decline about once every two years. A 25% decline about once every six. Peter Lynch probably wouldn't call himself a trader, but his math works for both sides. Keep this in mind if these types of numbers start registering in the markets.
@SchwabNetwork@SchwabTrading #SchwabCoaching #TraderTalks
The S&P 500 is just off all-time highs, and Peter Lynch wants you to remember this:
"There's been 50 declines of 10%+ in 93 years. Once every 2 years the market falls 10%."
"15 have been 25% or more. Every 6 years, a bear market."
"If you're not ready for that, you shouldn't own stocks."
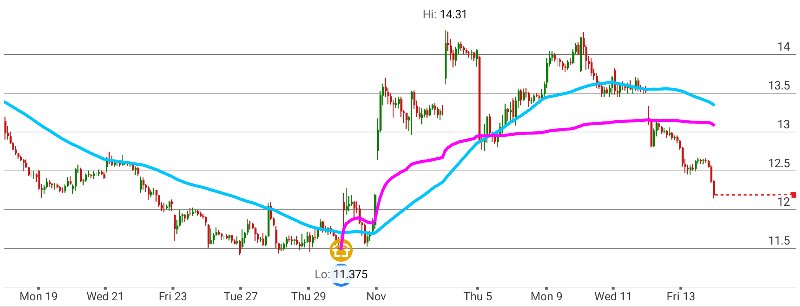
$RIVN: skepticism showed up right where it was flagged. The run toward 14.50 stalled at 14.31, and it closed the week down 10.5% at 12.18, below the pink VWAP from its Oct. 29 earnings low near 13.10. The 11.38 low that VWAP is anchored to is back in view.
@SchwabNetwork@SchwabTrading #SchwabCoaching #TOSMobile
20D:30m charts are for illustrative purposes only and not a recommendation.
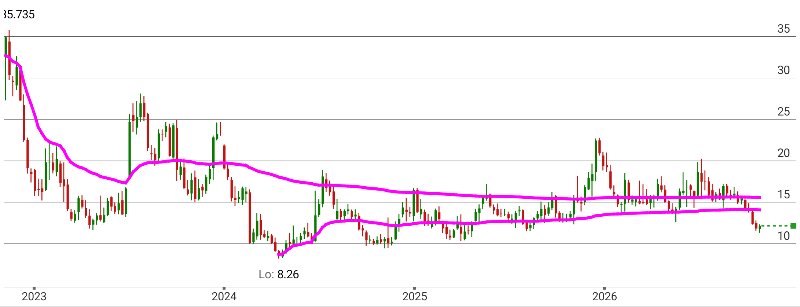
Asked to break down $RIVN on Morning Movers @SchwabNetwork. The two pink lines: it tried to get above its IPO VWAP, stalled, and has now slipped below the VWAP from its 8.26 all-time low, near 14.50. Gap ups or run-ups back toward that level, near where the daily 50-day SMA also sits, may deserve some skepticism.
@SchwabTrading #SchwabCoaching #TOSMobile
4Y:1W charts are for illustrative purposes only and not a recommendation.
One of the smoother bullish charts into the weekend is $DXY, green and above a rising 20, 50 and 200-day, all stacked in bullish order. Now testing 103, roughly its average price since the Sept. 30, 2022 high. Clearing it could open a quick move toward 107 to 108.
@SchwabNetwork@SchwabTrading #SchwabCoaching #TOSMobile
$DX_F 6M:1D charts are for illustrative purposes only and not a recommendation.
Futures and futures options trading involves substantial risk and is not suitable for all investors. Please read the Risk Disclosure Statement for Futures and Options prior to trading futures products.
Didn't have this on my 2026 bingo card: in a year when $BTC is down 33%, rough rice's impressive run has it up 45%, just behind gas and oils in #Commodities. $ZR_F could be headed back into the sack at monthly resistance near 19 to 20, its 2022 to 2024 ceiling.
@SchwabNetwork@SchwabTrading #SchwabCoaching #TOSMobile
$ZR_F Max:1M charts are for illustrative purposes only and not a recommendation.
Futures and futures options trading involves substantial risk and is not suitable for all investors. Please read the Risk Disclosure Statement for Futures and Options prior to trading futures products.
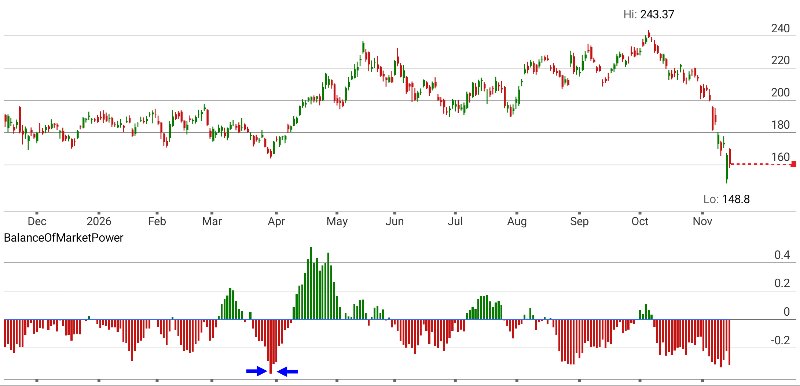
$NVDA's Balance of Market Power, which measures whether buyers or sellers controlled each day from open to close, is deep in seller territory. I expected to look back years to find it this out of balance. I only had to go back to April.
@SchwabNetwork@SchwabTrading #SchwabCoaching #TOSMobile
1Y:1D charts are for illustrative purposes only and not a recommendation.
Zooming out on $NVDA: this volume thrust broke above a year of declining volume. Another bullish signal could be a Friday close above Monday's open. Lots of time left today for traders to decide where this goes.
@SchwabNetwork@SchwabTrading#SchwabCoaching#TOSMobile
4Y:1W charts are for illustrative purposes only and not a recommendation.
Zooming out on $NVDA: this volume thrust broke above a year of declining volume. Another bullish signal could be a Friday close above Monday's open. Lots of time left today for traders to decide where this goes.
@SchwabNetwork@SchwabTrading#SchwabCoaching#TOSMobile
4Y:1W charts are for illustrative purposes only and not a recommendation.
$NVDA has respected its 5-day moving average since Oct. 30. It bounced and closed above my noted 165 level, but a stall out and crack through 163 tomorrow could prove the blue line a ceiling, not an area for bullish opportunity.
@SchwabNetwork@SchwabTrading#SchwabCoaching #TOSMobile
20D:30m charts are for illustrative purposes only and not a recommendation.
#US10Y shows how hard it can be to fade right now. Yields are pressing into the 52-week high VWAP. Stop above 5.18, then reassess. If that resistance holds, yields still need to get back below the highest volume day VWAP for the fade to look cleaner.
@SchwabNetwork@SchwabTrading #SchwabCoaching #TOSMobile
3M:1D charts are for illustrative purposes only and not a recommendation.
#US10Y fighting the rounding out, pushing against its 52-week high VWAP and 20-day SMA. The past year's highest volume day (HVD) VWAP flipped from under to over price. If it holds, the 2Y HVD VWAP near 4.45 could be the next level that price moves toward.
@SchwabNetwork@SchwabTrading #SchwabCoaching #TOSMobile
3M:1D charts are for illustrative purposes only and not a recommendation.
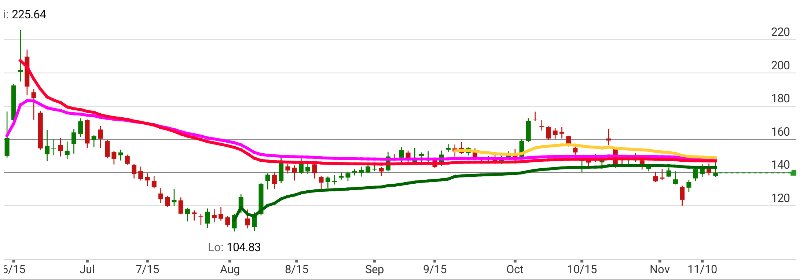
$SPCX now trades under all four anchored VWAPs: its IPO, all-time high, all-time low and largest volume day, stacked between roughly 142 and 148. Not a bullish position for a company many expected to take off. For now, it's grounded.
@SchwabNetwork@SchwabTrading#SchwabCoaching #TOSMobile
Max:1D charts are for illustrative purposes only and not a recommendation.
Discussed $SPCX on The Watchlist @SchwabNetwork today.
Broke out of its base last week, and into telecommunications this week, only to pull back toward the launch pad. The 20 day, 50 day and June anchored VWAP all sit below price. Earnings November 3.
@SchwabTrading charts are for illustrative purposes only and not a recommendation.
$NCLH: follow through matters. Without it, the downside can come quickly. Rejected at 18.60 three times, it turned hard to starboard. Now it's anchored on its earnings VWAP (in pink) near 18. If that slips, 17.30 is the port of least resistance.
@SchwabNetwork@SchwabTrading #SchwabCoaching #TOSMobile
20D:30m charts are for illustrative purposes only and not a recommendation.
$NCLH's earnings gap is taking on water, slipping under both pink VWAPs, one from the earnings gap and one from Monday's gap on bullish analyst notes. The short-term trend is pointed back toward its port of origin near 16 if the 17.30 area fails. A hold here could keep the gaps afloat.
@SchwabNetwork@SchwabTrading #SchwabCoaching #TOSMobile
5D:5m charts are for illustrative purposes only and not a recommendation.
$NVDA has respected its 5-day moving average since Oct. 30. It bounced and closed above my noted 165 level, but a stall out and crack through 163 tomorrow could prove the blue line a ceiling, not an area for bullish opportunity.
@SchwabNetwork@SchwabTrading#SchwabCoaching #TOSMobile
20D:30m charts are for illustrative purposes only and not a recommendation.
$NVDA's woes continue after hours, down 8.6% to 158.76 and below the blue line at 165 that I flagged as a logical spot to slow. If it can't reclaim 165, the gold VWAP from its biggest volume day could come into view sooner than later.
@SchwabNetwork@SchwabTrading #SchwabCoaching #TOSMobile
Tickers mentioned are for illustrative purposes only and not a recommendation.
$GOOGL got its green close above the blue line at 296.50, with the gap VWAP (in pink) near 290 and its largest volume day in 10 years VWAP in gold near 285 underneath. Next area of focus: the Oct. 29 gap starting near 324, roughly 8% to 9% above today's close.
@SchwabNetwork@SchwabTrading #SchwabCoaching #TOSMobile
3M:1D charts are for illustrative purposes only and not a recommendation.
$GOOGL is still holding above its gold VWAP near 284. The next telling sign would be a green close above the blue dashed line at 296.50. This subtle detail can help avoid entering gap ups that get dunked on. Patience is part of the process.
@SchwabNetwork@SchwabTrading #SchwabCoaching #TOSMobile
3M:1D charts are for illustrative purposes only and not a recommendation.