@aakankshalovely Being in the call writer side or put writer side shows your technical skill analysis of charts etc. stupids being in call writer side which is going to 0.and blaming cas for that is utter stupidity
And keep blaming cas do that.a volume surge label in claude could be 20 lines an vwap and ema 9 21 band
And their crossed can be colored as bars bullish colored bar for golden cross bearish colored bars on death cross. And volume surge onky trade abouve 2x volume on option chart
Empty Charters,
Remember a 50 spot move could spike an option from 10 to 40 atleast last 15 minutes of expiry days
Before blaming cas atkeast have 9 21 ema bands it may create a death cross if the premium will be xx to zero levels. Beware, or you will only have empty charts
@piyushchaudhry Untill you kearn patterns you keep on question ❓❔❓❓
3.06 pm inverse head and shoulders target was 24200 in 1 minute timeframe
12.00 inverse head and shoulders neckline is 24200 in 5 minutes timeframe
Without price institutions cant move to a certain position. Patterns
@Blu_Dragon_YT@PRAFULKULKARN18@IRITA_india@_groww Thats what am saying more companies already done that before cas with little capital. Now with cas they are getting caught whats the problem for u?? Do u abolish cas and supporting those institutions move index 200 points at last two minutes and escape??
@KiranjitDas86 By directional oi buildup is dine for hedging so obviously you have to scalp or intraday positional. Because volatility is both ways.
You cant just buy an option and sell it at 3.30 hereafter. Its not stock to trade like that.
@Blu_Dragon_YT@Blu_Dragon_YT try to have 30 seconds timeline in your charts, it shows more up and downs that one minute timeframe never shows during cas. I built cas iep polling using kites iep data and have both 30 seconds and 1 minutes timeframe.
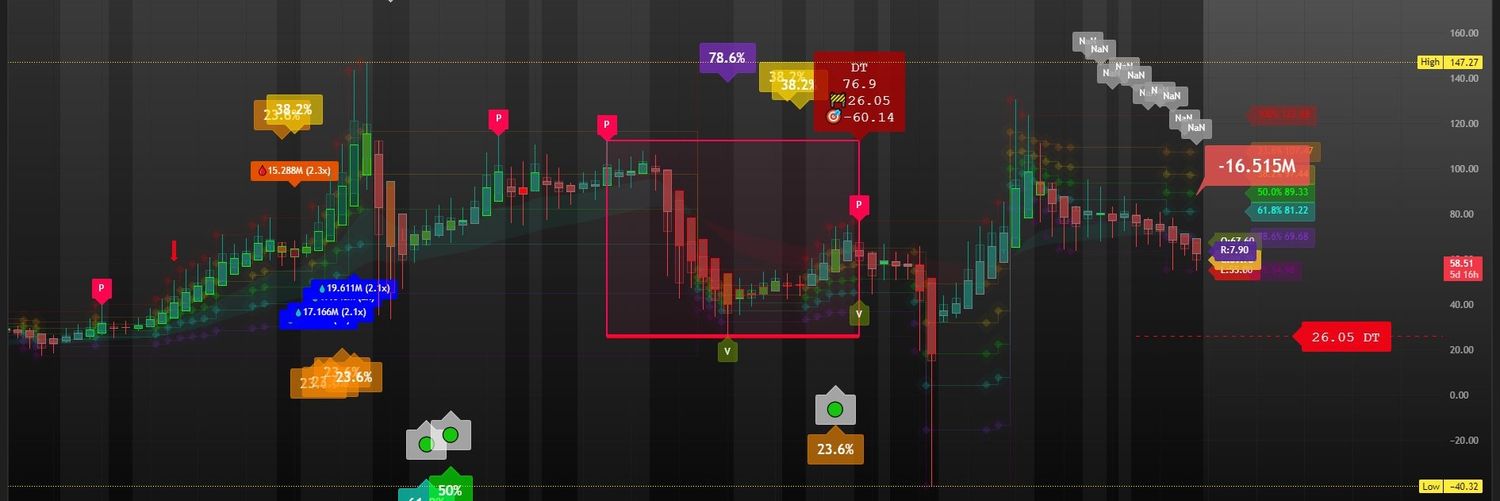
@Nithin0dha Kindly let me know if you need this code.Its a complete system with autofibanocci labels, vwap slopes bullish bearish neutral, volume surge labels etc @Nithin0dha#PatternPredator
https://t.co/WdbTx6VIce
I knew where nymex crude supposed to reach before trumps tweet, every ceasefire tweets where nifty suppose to reach, my code predicts where the nifty reach before finance minister's stt hike on feb 1 I think.
Famous negative oil predicted 18 months ago.
@Nithin0dha
@Nithin0dha Trumps tariff reduction also planned previous day, my pine script has head and shoulders inverse head and shoulders doubke bottom double tops with price in it as label. Wilth accuracy of 💯, i have the code which famous institutions had. Kindly che my portfolio of trade charts.
@CommerceGuruu What of u there at profit side when so called manipulation happens would u given that money to sebi?
Profit and loss controlled by you.
If ur chart shown the direction you would have prevent losses. Dont blame market...
Or atleast find a way to help yourself indicators or have safety measures. Because old system no way to find these manipulations as per sebi #emptycharters#patternpredator#isupportcas
So if Cas able to find manipulation which was impossible in okder system good for us? But if i company place orders more than reference price why the order wasn't rejected in submission phase itself?
Sebi wont settle loses, so find a way to profit from this,
if above patterns not possible A vwap/ema 9/21 band Golden cross/death cross markeing bars ith colors
Volume Spike labels(Institutional Capital commitment),Must in your chart.otherwise no one save you from https://t.co/1gzvDLR5wU.
Dear Empty Charters,
This might be my final post #CAS is not a problem,your charts were always!!!Have Inverse Head and Shoulders and Head and Shoulders in nifty/Sensex Entire World indices can align with these two patterns and HDFC NVDA MSFT Whatever the stocks works with these!
it must shows
Head and shoulders :Head/Neckline/TARGET/Support
Inverse Head and shoulders:Head/Neckline/TARGET/Resistance
Double Bottom:Valley 2/Neckline/TARGET/Resistance
Double Top:Peak 2/Neckline/TARGET/Resistance
I mean it must show where the prices going.Everything is Maths