Here's my process for top-down sector investing and investing overall! Be sure to read to number 6:
1. Watch sector momentum and relative strength vs. the S&P 500. The best tool for this is the Relative Rotation Graph (RRG) on @StockCharts.
2. For the sector you are focused on that is leading, pull up the largest sub-sector ETFs.
3. Take their top 10–20 cumulative holdings and compare those names' momentum and relative strength back against the sector itself.
4. Decide how you want to play it — a few stocks leading the momentum, or the broader sector/sub-sector ETF(s).
5. Pull the full holdings of whatever sector or sub-sector ETF you're looking at, grab the average and median analyst price target plus the 52-week high for each name, and weight them by position size to build a composite price target for the ETF itself. This provides you with some cumulative fundamental analysis and a framework for risk-reward analysis, and a level to re-evaluate the position. I like the composite as it incorporates fundamental and technical data points I can't do at scale.
6. Look at a shit ton of charts every day hunting for bad ass set ups, and don't care about any of that.
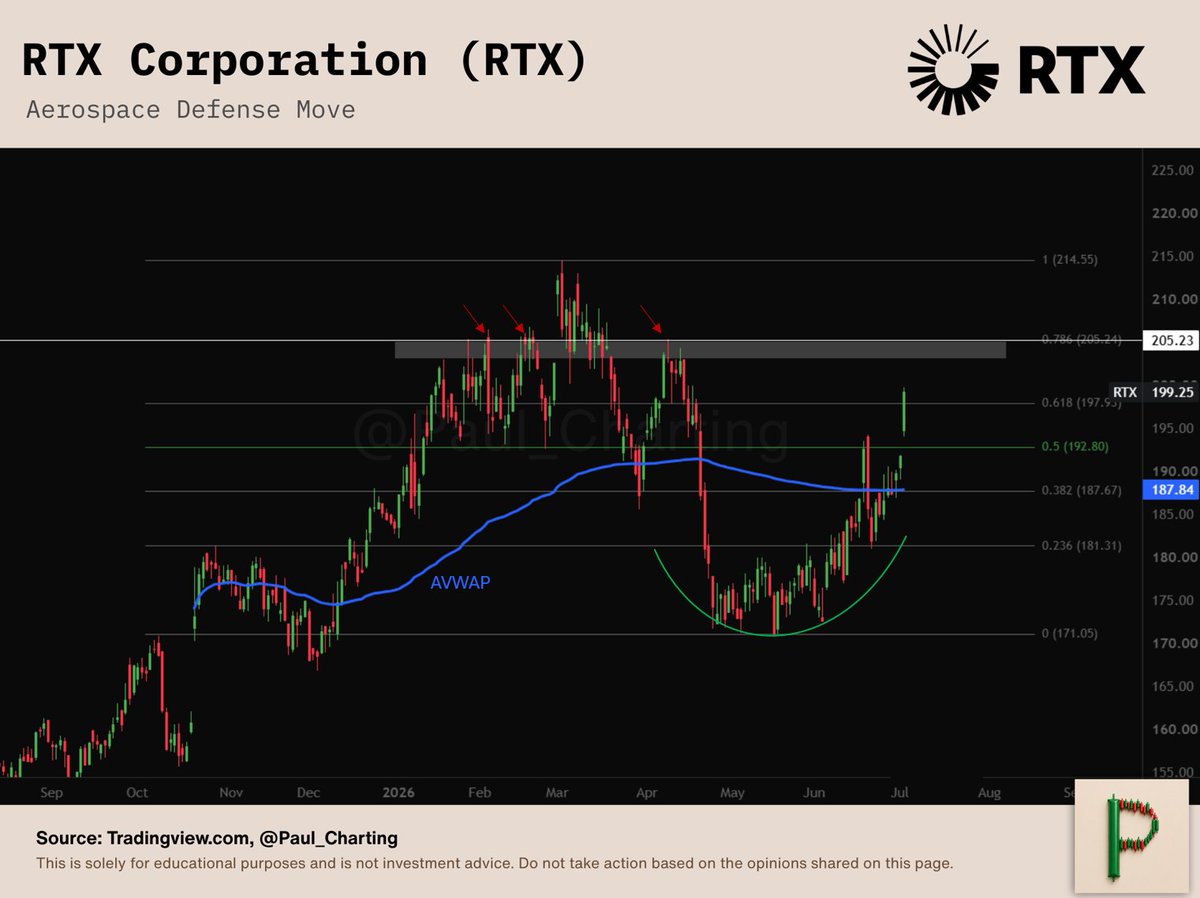
"Aren't wars ending supposed to be bad for defense stocks?" - Investors
"Hold my beer" - $GD, $GE, $RTX
Great callout @HostileCharts. There are some great charts below the hood for $ITA
All three are in the top ten holdings and are either breaking out or have bottomed and are reversing trend
@HostileCharts Great call out. There are some great charts below the hood for $ITA
$GD, $GE, $RTX, are all either breaking out or have bottomed and are reversing trend
@NotA_Bull $SCHD is overrated big time - $RDVY, $CGDV, $VFLO are all better value proxies.
$QQQ is just a concentrated $VOO. Owning both makes no sense.
If you want real diversification that adds alpha - $XMMO, $XSMO, $AIRR, $ACWX, $EEM
🇺🇸 Happy 250th, America.
When this series begins, the market is mostly railroads. Then the telephone (1876), the light bulb (1879), powered flight (1903), the Model T (1908), the transistor (1947), the moon landing (1969), the microprocessor (1971), the World Wide Web (1989–1991), the iPhone (2007), and now AI.
Every panic on this chart felt like the end at the time — 1907, 1929, 1987, 2008, 2020. On a log scale, there are pauses in a compounding machine running at roughly 9% with dividends reinvested.
America is the greatest country in the world. Our union isn't perfect — but its foundation has created freer, wealthier, and more empowered people than any in history. This is the nation of freedom and capitalism, and we must fight to uphold those two pillars. Here's to getting our house in order and making it another 250.
Shout out to America.
$SPY $VOO
$CME has dropped from $305 to $230 in a matter of weeks and is now testing the anchored VWAP that's guided its entire uptrend — the same line those green arrows show buyers defending again and again.
The sell-off is really about one big question: tokenization. The market's worried that tokenized, 24/7, on-chain markets could eventually disrupt CME's traditional futures-and-clearing model — though CME is building its own tokenization and stablecoin efforts right alongside that threat. RSI is now washed out to levels that marked the 2022 bottom.
At $230, the stock sits about 31.5% below the $304 analyst target and would need a 38% move to reclaim its $320 all-time high. Whether this VWAP holds one more time is the whole question — hold it, and it's a textbook pullback into support; lose it, and a years-long trend comes into doubt.
$IBM spent the first half of 2026 stuck in a downtrend, but that looks like it's changing.
Two things turned at once. Price carved out a rounding bottom off the $215 lows and has climbed all the way back to $287, while RSI finally broke the downtrend that had capped momentum all year. When price structure and momentum shift together like that, it's usually a real trend change rather than just a bounce.
From here, the path of least resistance looks higher, back toward that $305–310 shelf — the same zone that rejected the stock hard back in April. Whether it can break through on the next attempt is the open question, and I'm not calling that yet. But the setup is constructive: base built, momentum turned, and price pointed at the level that decides the bigger move.
$LIT, the Global X Lithium & Battery Tech ETF, has quietly put together one of the more impressive runs in the market — eleven straight months higher off the 2025 lows, nearly doubling from the low 40s to the upper 70s.
Now it's run right into the wall that's capped it twice before. That gray shelf around $91 rejected price hard in 2021 and again just now, so this is the third time buyers are testing a level that's turned them away every other time. RSI is also pushing back up near overbought on the monthly, which is where the last two major tops formed.
So this is the spot that matters. A monthly close that clears $91 would be a genuine breakout from a multi-year base, and there's open air above it. Get rejected here again, and it sets up a pullback after a big, extended run. Either way, $91 is the line that decides whether this is a new uptrend or not.