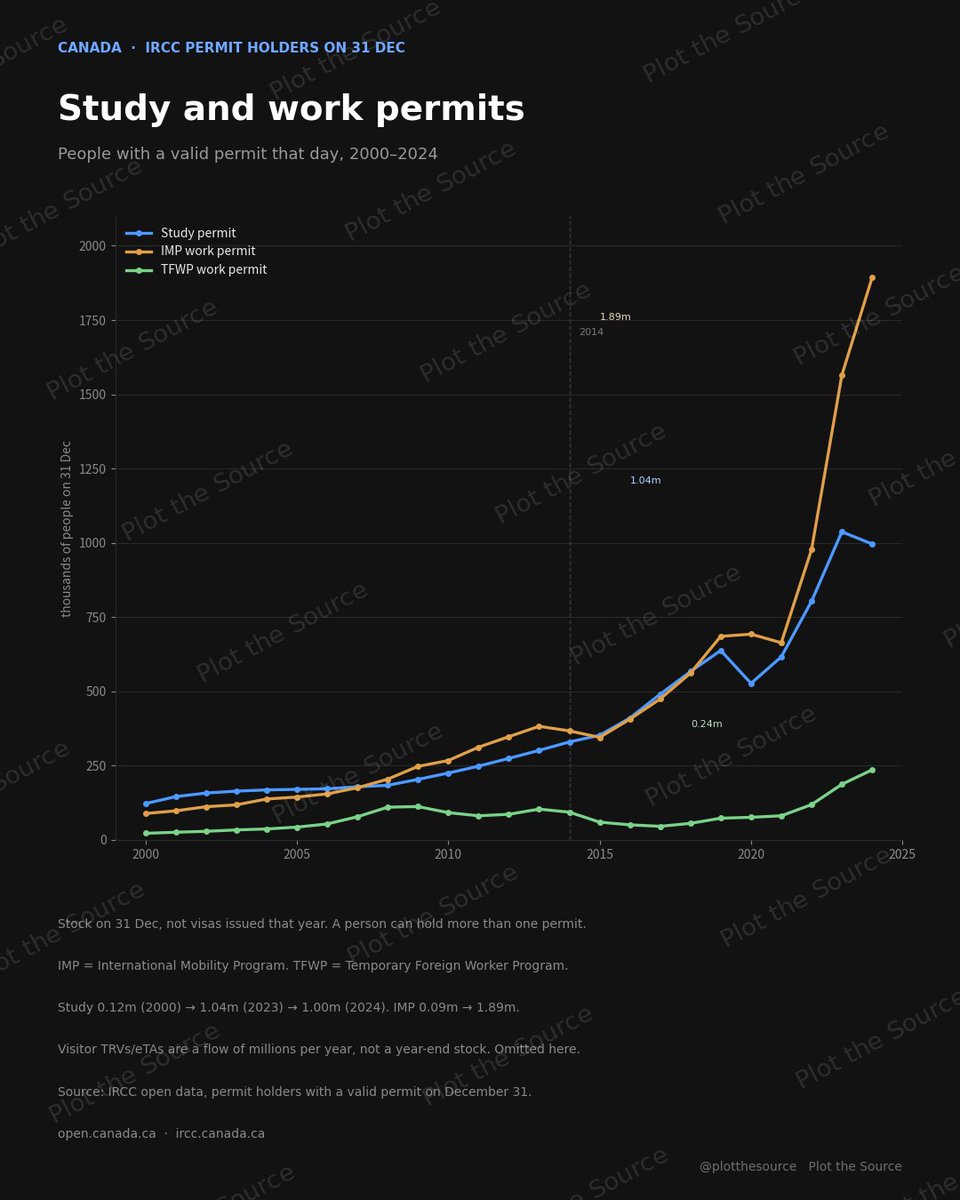
Blue = study. Gold = IMP. Green = TFWP.
The steep climb is after 2021, and it is the IMP line.
Study turned down in 2024 after the intake cap.
Visitor TRVs/eTAs are a flow of millions. Not on this card.
Canada. Valid permits on 31 Dec.
Study 0.12m (2000) → 1.04m (2023) → 1.00m (2024)
IMP work 0.09m → 1.89m (2024)
TFWP work 0.02m → 0.24m (2024)
Stock, not visas issued. Same person can hold more than one permit.
IRCC open data.
Statistics Canada, 16 December 2024: https://t.co/xMsRqRX99W
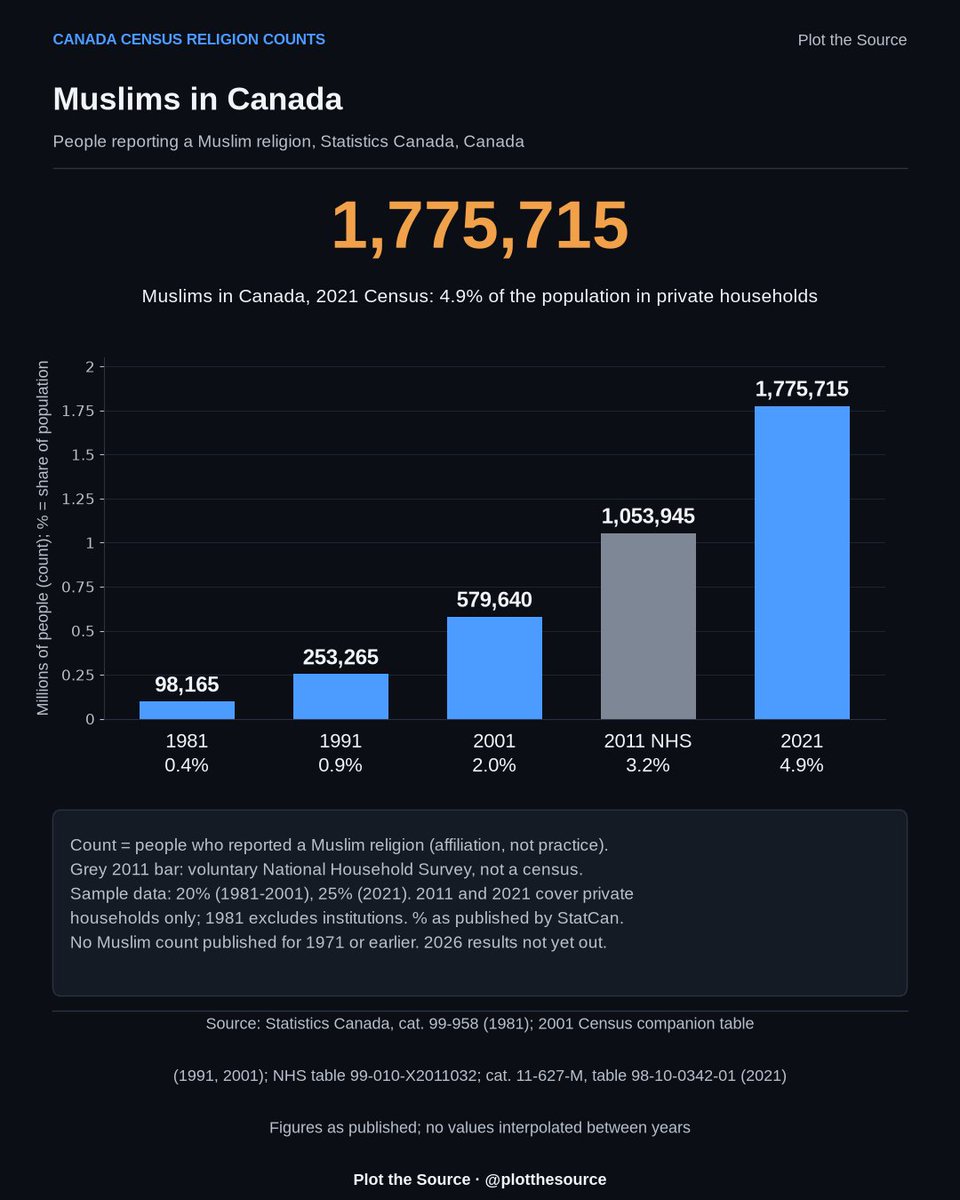
Self-reported religious affiliation, from the 25% long-form sample, for people in private households. The 2011 figure is from the voluntary National Household Survey.
1,775,715 people in private households reported their religion as Muslim in Canada's 2021 Census, 4.9% of that population.
Grey bar: 2011 National Household Survey (voluntary). Other bars: census counts.
Self-reported affiliation. The census normally asks religion every 10 years.
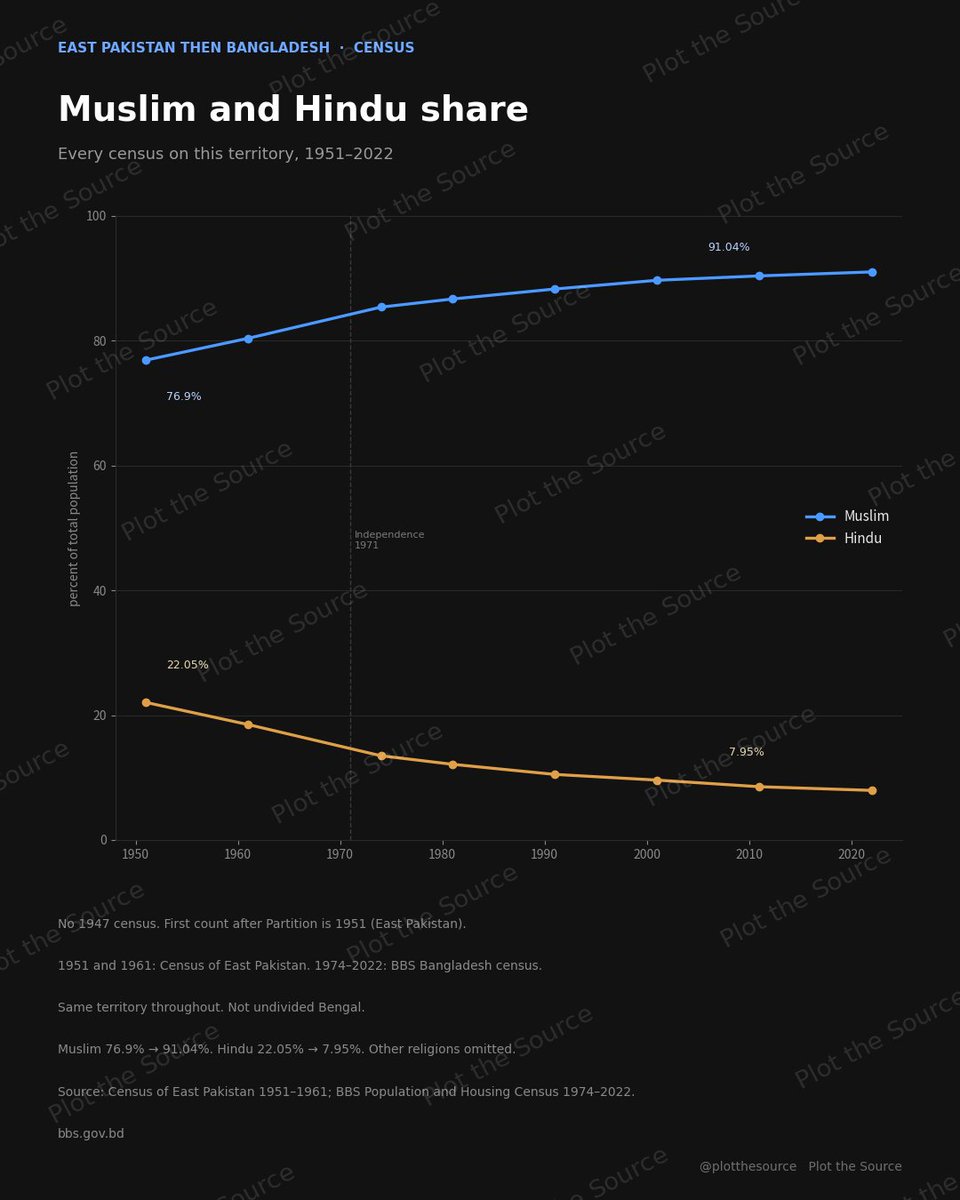
East Pakistan, then Bangladesh. Census shares.
Muslim 76.9% (1951) → 91.04% (2022)
Hindu 22.05% (1951) → 7.95% (2022)
No 1947 census. First count after Partition is 1951.
Census of East Pakistan; BBS 1974–2022.
Blue = Muslim. Gold = Hindu.
Dashed line = independence, 1971.
Same territory the whole way. Not undivided Bengal.
Other religions omitted from this card.
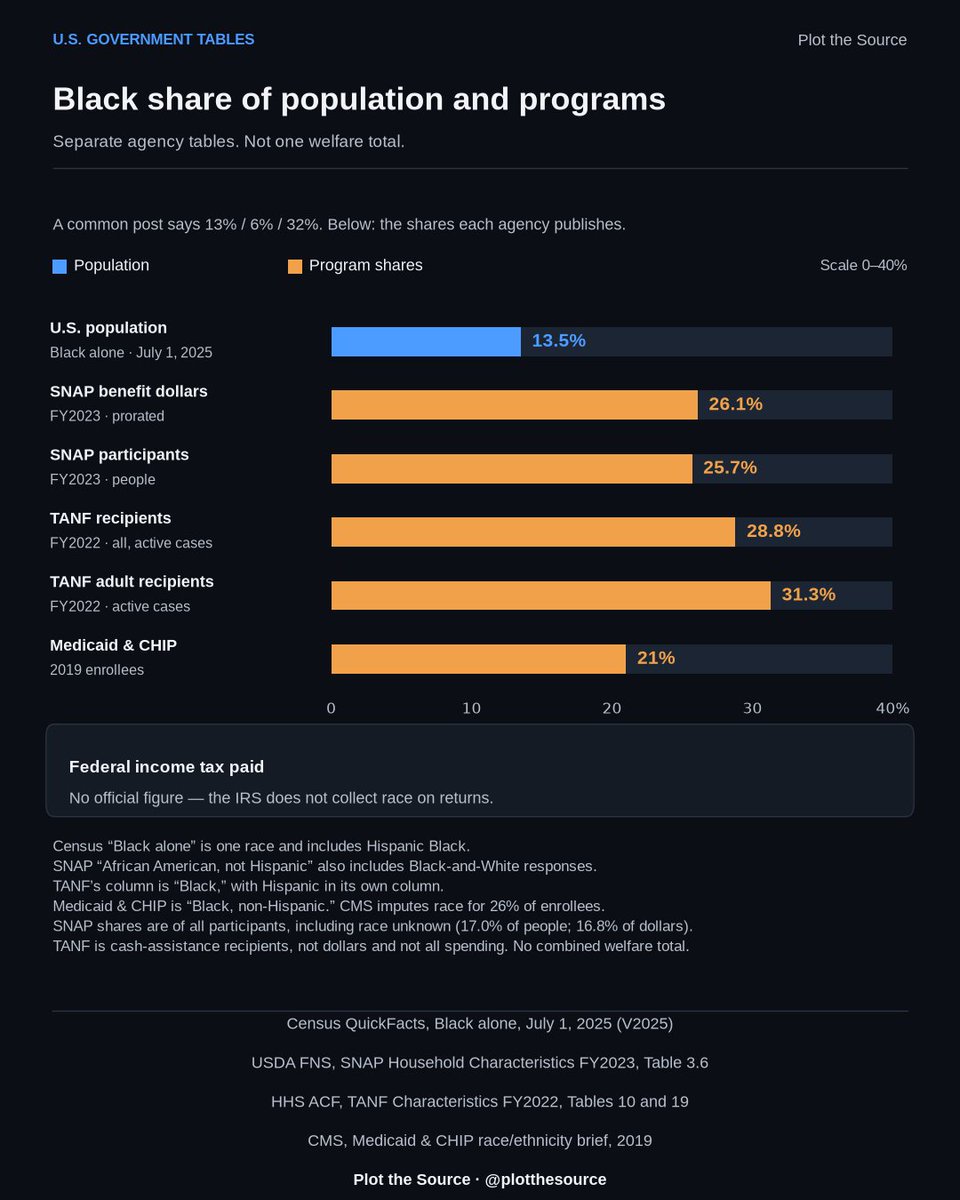
Census July 1, 2025: https://t.co/QzRzu7cKlz
SNAP FY2023 Table 3.6: https://t.co/AyVQ1QYe9a
TANF FY2022 Tables 10 & 19: https://t.co/Lf0chzAWYu
CMS 2019: https://t.co/diZtSh4NJx
Black alone includes Hispanic Black. Race category differs by table. IRS collects no race on returns.
13.5% of Americans are Black alone. In SNAP, TANF and Medicaid/CHIP, Black shares range from 21% to 31.3%.
Blue: population share. Amber: program shares.
Each agency uses its own race category. SNAP race unknown is 17%. The IRS publishes no tax share by race.
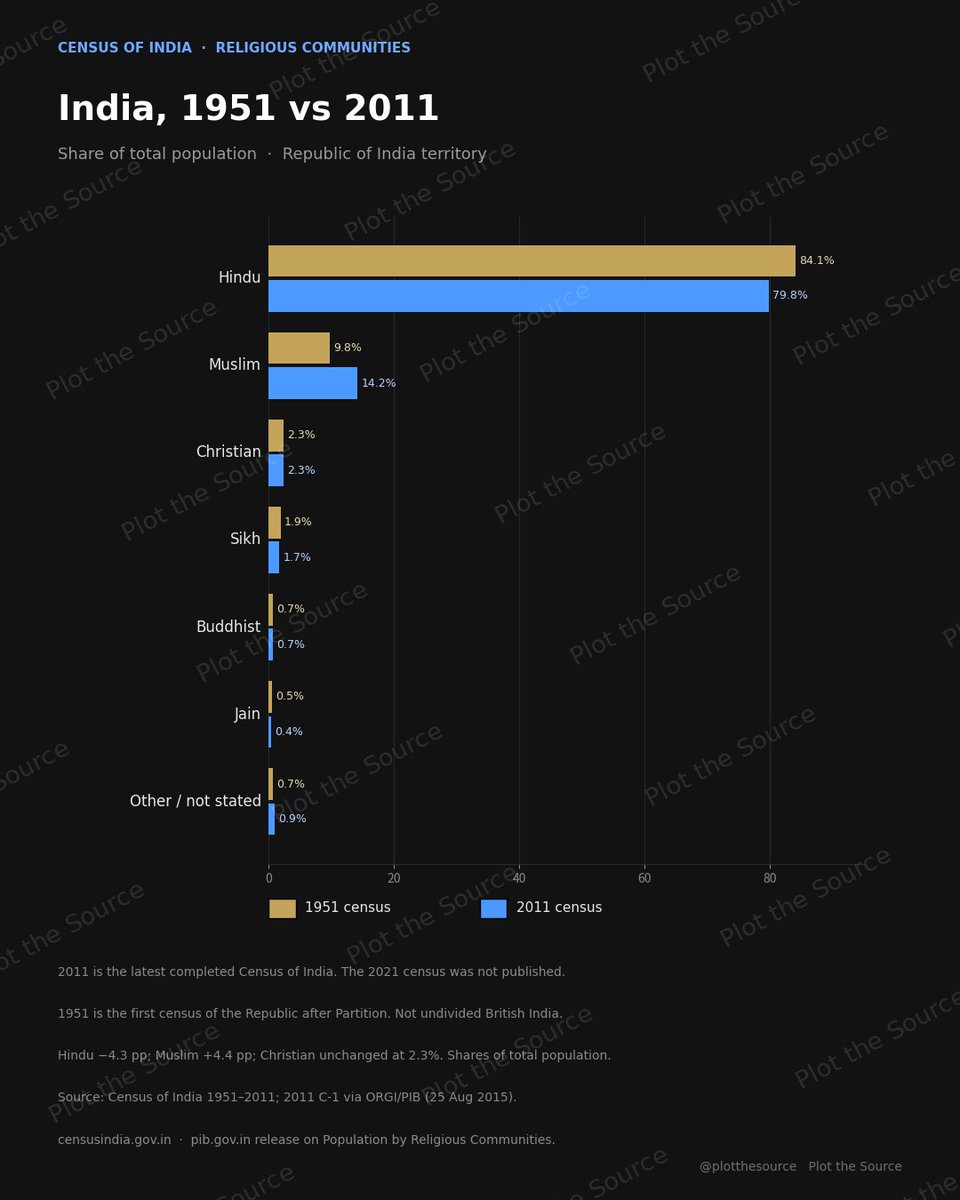
Share of total population
Hindu 84.1 / 79.8
Muslim 9.8 / 14.2
Christian 2.3 / 2.3
Sikh 1.9 / 1.7
Buddhist 0.7 / 0.7
Jain 0.5 / 0.4
Other/not stated 0.7 / 0.9
1951 / 2011. Census of India.
India religious composition, Census of India.
1951 → 2011
Hindu 84.1% → 79.8%
Muslim 9.8% → 14.2%
Christian 2.3% → 2.3%
Republic territory after Partition. 2011 is the last completed census.
PIB/ORGI C-1: https://t.co/7hlKKH7aqR
How to read this:
Gold = 1951 census. Blue = 2011 census.
Same country after Partition — not undivided British India.
No completed census after 2011.
Christian share unchanged at 2.3%. Sikh 1.9% → 1.7%. Buddhist 0.7% both years.
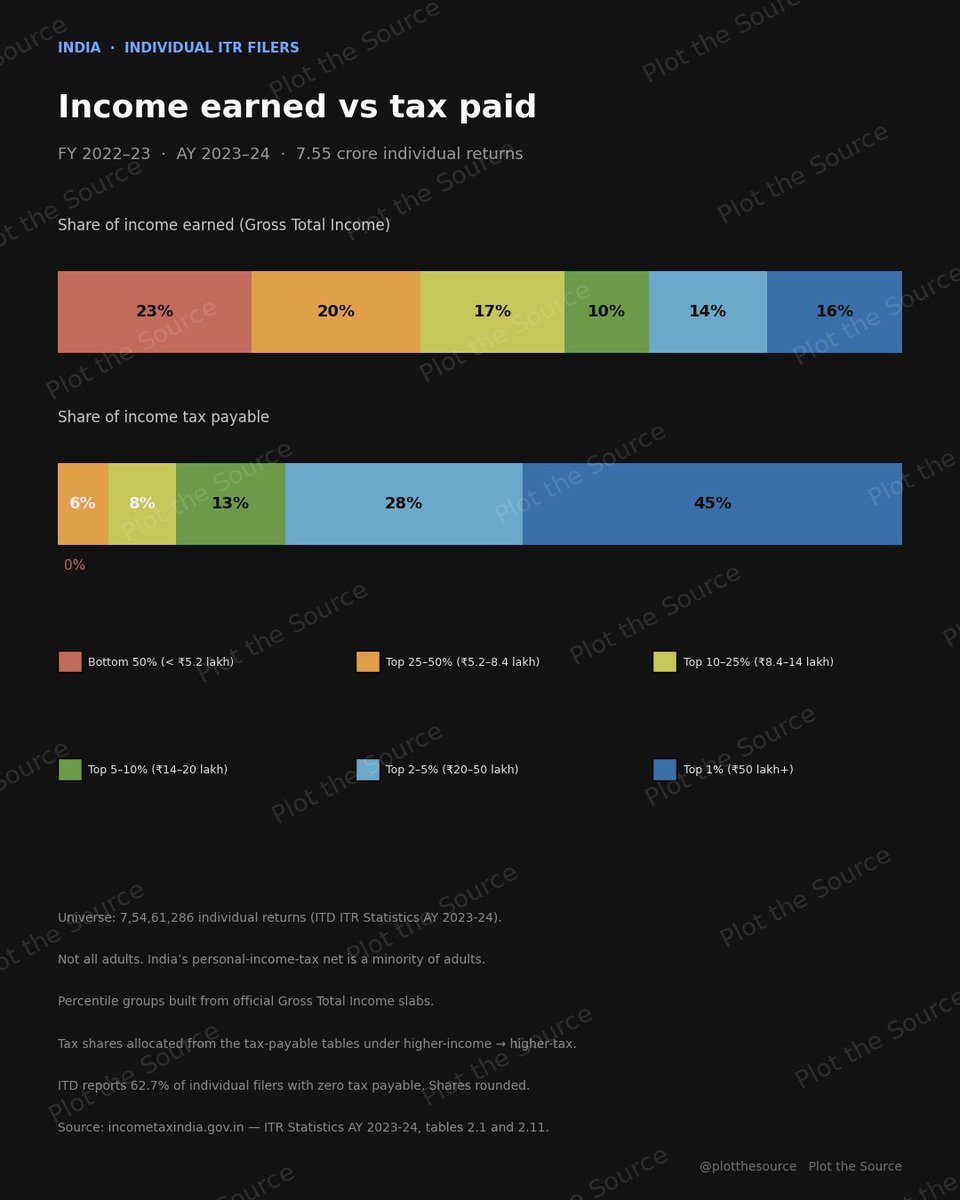
India individual Income Tax Return (ITR) filers, FY 2022–23 (AY 2023–24).
Bottom 50% of filers: ~23% of income, ~0% of tax.
Top 1%: ~16% of income, ~45% of tax.
Filers only — not all adults.
ITD ITR Statistics AY 2023-24:
https://t.co/AJuNfcvpnS
How to read this:
Same colour = same filer group.
Top bar = share of Gross Total Income.
Bottom bar = share of income-tax payable.
ITD does not publish tax by percentile. Groups were built from official GTI slabs; tax was allocated using higher-income → higher-tax. Shares rounded.
62.7% of individual filers had zero tax payable.
Bangladesh census. Muslim and Hindu share.
1974 → 2022
Muslim 85.4% → 91.04%
Hindu 13.5% → 7.95%
1974 = first census after independence.
2022 = latest completed census.
BBS Population and Housing Census.