In 8 states, at least half of 2026 homebuyers put less than 5% down. Mississippi: 61%. New York: 22%. Massachusetts: 20%. A 3x regional spread, from loan-level Fannie, Freddie & Ginnie data. MBS Pivot, through May 2026
What makes a mortgage predatory? Flipping, packing, stacking, and targeting.
Dive into the history in our latest Common Ground post: https://t.co/8QbX7eNqi0
Mortgage market intelligence should make the next decision clearer. Polygon Research connects the market around the questions that matter.
https://t.co/ZK91JsWFFB
The average agency purchase loan rose from $233,409 in 2018 to $360,320 YTD 2026.
But 70% of that increase had already happened by 2022. The loan-size tailwind behind purchase dollar volume has weakened.
Explore the refreshed Polygon Pulse:
https://t.co/Fh1stJv3MT
In 1890, seven of every ten mortgage dollars in America came from a private individual.
National banks were barred from real estate lending by statute until 1913. ↓
See the complete 8-page carousel and explore the history:
https://t.co/t2zZFnWyMj
How big is the multigenerational housing market?
5.1M households under the Census definition of 3+ generations.
6.4M adding skipped-generation households.
26.7M adding all shared adult generations, about 1 in 5 US homes.
Same data. Different question.https://t.co/gjaakcU5P7
Median property values for manufactured home purchase mortgages secured by real estate: $150,000 in Illinois to $415,000 in Washington, 2025.
Only 37.3% of buyers finance with a mortgage. The rest pay cash.
81,138 originations. HMDA via HMDAVision.
https://t.co/ArDlZJIRao
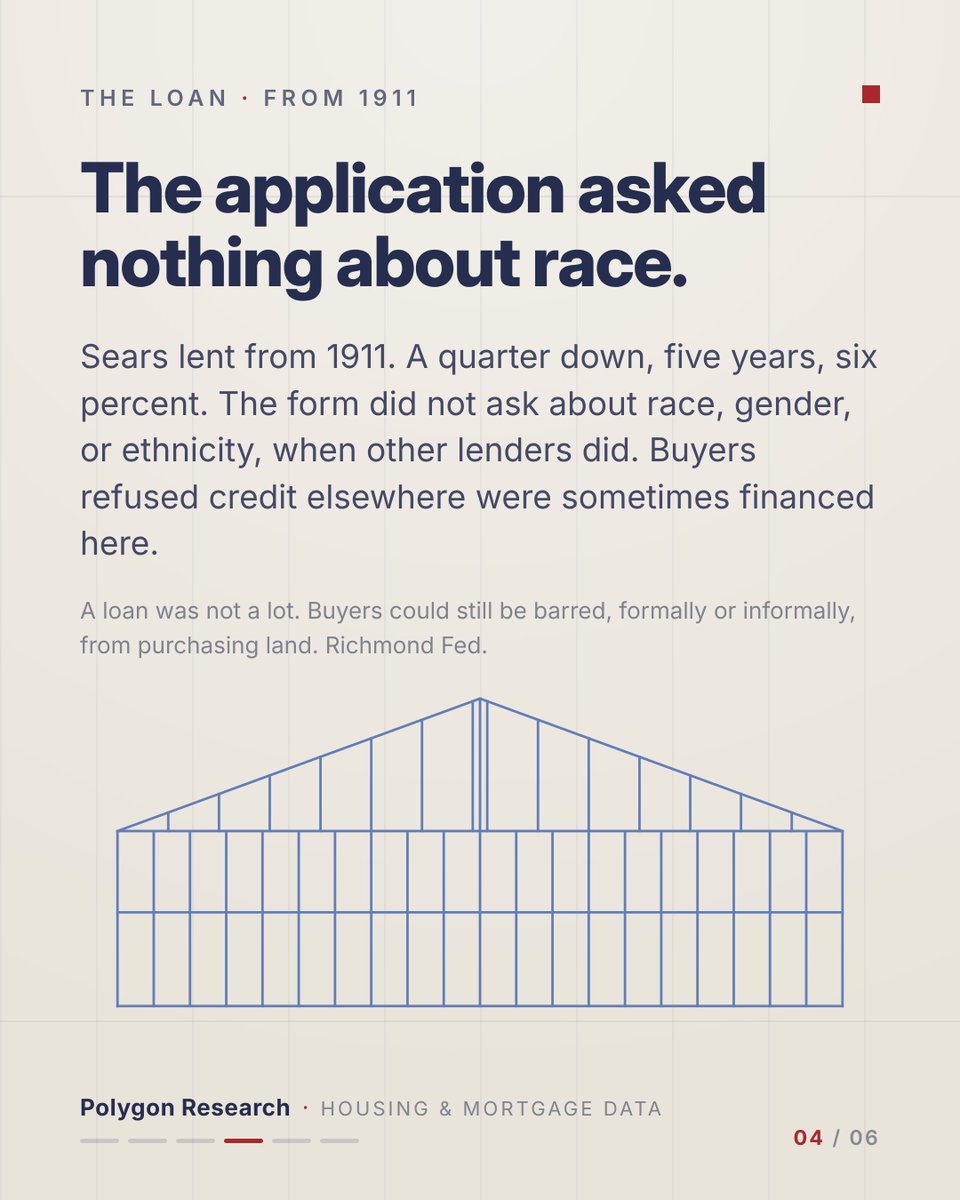
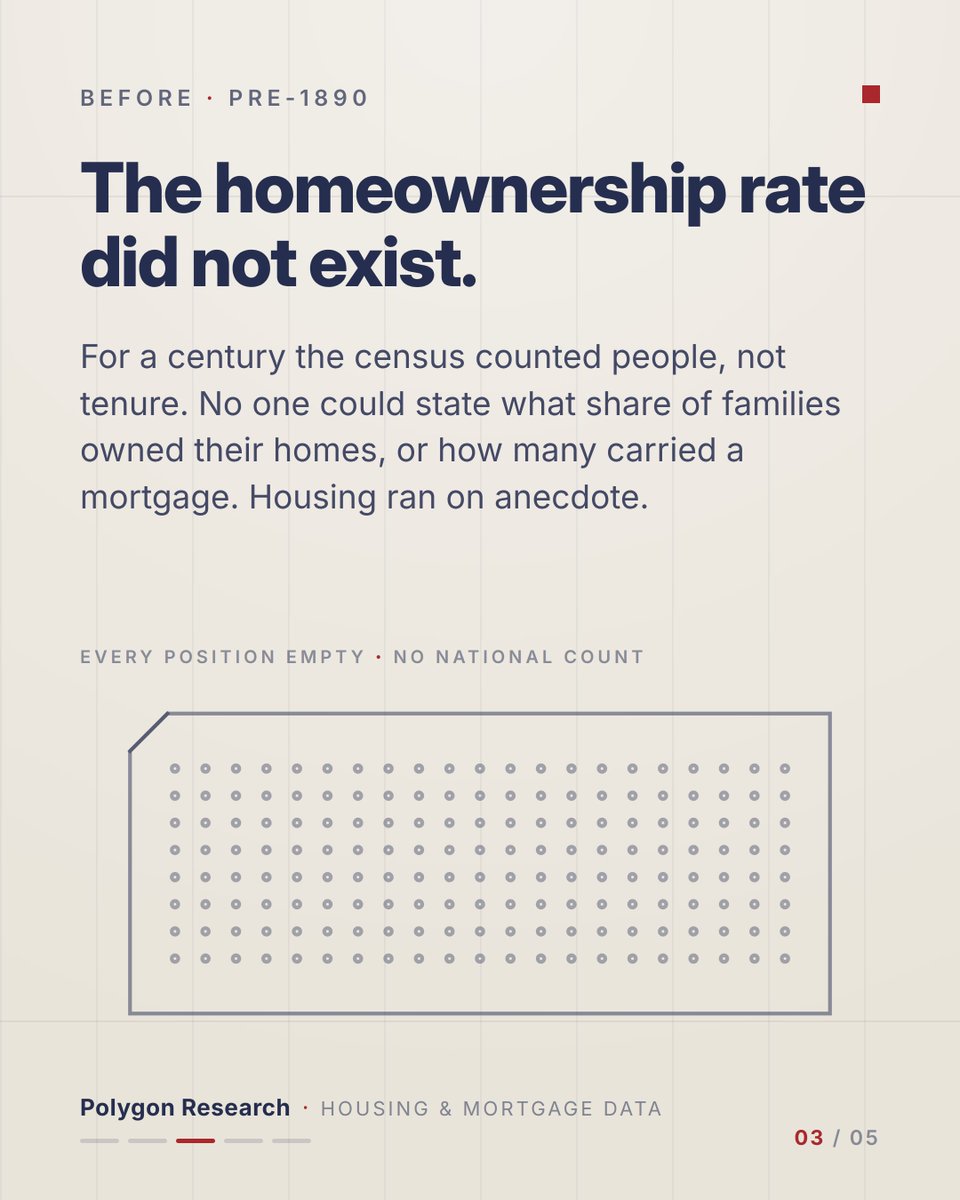
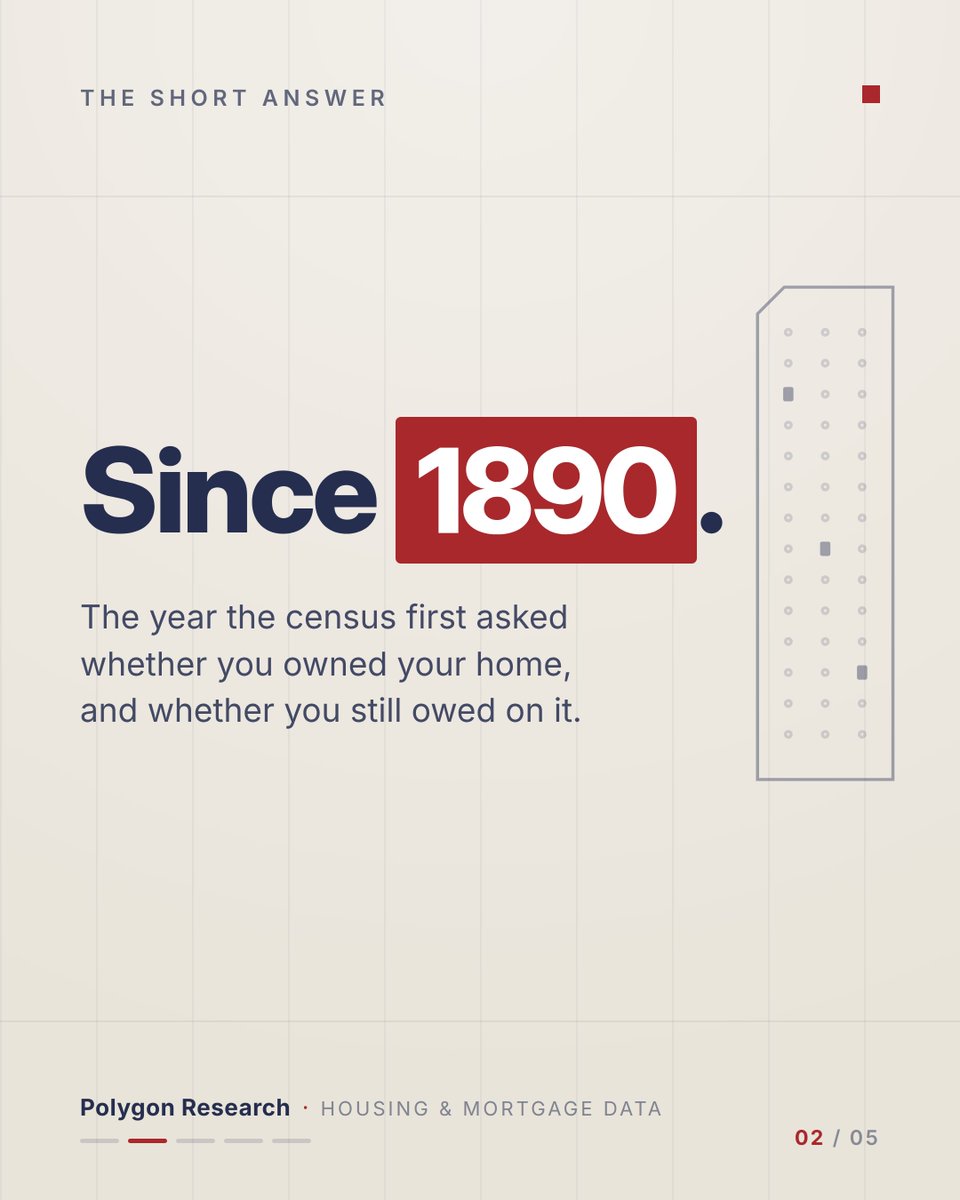
In 1908 you could order a house from a catalog. The blueprints came in a leather book with your name stamped on it, and the house arrived at the depot in a boxcar.
How that worked, and why it stopped. ↓
https://t.co/OoCMZ6vOC7
How useful is “first-time homebuyer” as a market segment?
First-time buyers took 60.3% of agency purchase loans in H1 2026.
48.8% financed their purchase with FHA, VA or USDA loans.
55.8% closed with one borrower vs. 52.2% of repeat buyers.
The details reveal the opportunity. https://t.co/6OcscYMj0V
What should mortgage market intelligence help a lender see?
Where activity is changing.
Who is shaping demand.
What products are moving.
Who is gaining ground.
What opportunity is being missed.
The answers require a connected view of the market.
Explore mortgage market intelligence from Polygon Research: https://t.co/QT1sQVt1je
Much of the discussion about new credit-score models focuses on policy and implementation. On Risk & Roll, Greg Oliven looks at the data: FICO 10T and VantageScore 4.0, middle/lower/lowest versus average/average, and what the new GSE dataset allows us to examine at the loan level.
Watch on YouTube: https://t.co/KpR6es4oUz
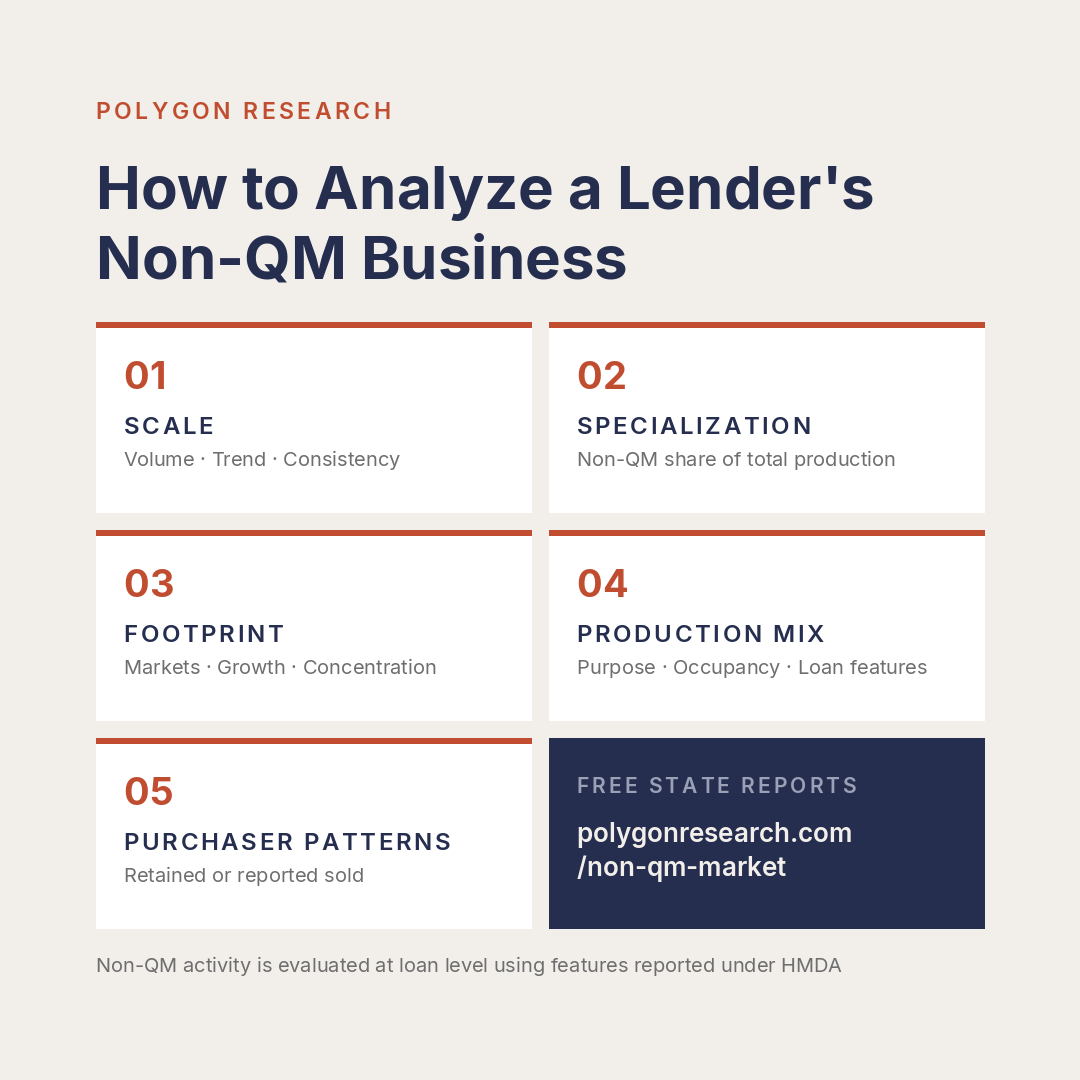
A ranking shows scale, but only part of the business. We classify every origination at loan level and flag it QM, Non-QM or Out of Scope. Five things that makes measurable about a lender's Non-QM activity: scale, specialization, footprint, production mix, purchaser patterns.
https://t.co/b2nKwE5j2u
Nathan Knottingham on the Risk & Roll podcast, on the research and where to find it: https://t.co/yjzDVRIVLN
Risk& Roll, full episode: https://t.co/FMQaj3Zafq
FHA borrowers hold the lowest ARM rates of 2026. Average note rates on agency ARM originations by loan type, 2026 year-to-date through June: Conventional 5.14% | VA 4.69% | FHA 4.57%
Note rates only. ARM features (index, margin, fixed period, caps) are not included.
Full chart → https://t.co/SMNj67JtPL
Source: Polygon Research, Polygon Pulse (MBS Pivot)
There are dollars in the data. Dana Georgiou on using data meaningfully to strengthen the lending business and better serve homeowners and homebuyers.
Watch the full Risk & Roll podcast: https://t.co/uFPCIEQ1N4
At the intersection of mortgage strategy, fair lending, and the law, data can help lenders make better decisions and serve communities more responsibly.
Greg Oliven on Risk & Roll. Watch the full episode: https://t.co/gGWf46CWV4
Polygon Pulse is refreshed through mid-2026. Agency originations total 1.49 million loans YTD at a blended 5.95% note rate: Fannie Mae at 6.10%, Freddie Mac at 6.07%, and Ginnie Mae at 5.75%. Ginnie Mae accounts for 40.9% of volume by loan count. MBS Pivot, FHA Pivot, and CPS Pivot are all updated with the latest monthly data, covering agency originations, FHA rates down to zip code, and US household demographics. https://t.co/5hhsqdL6Q1
FHA ARM refinances were barely visible for years, but 2026 has brought a sharp increase, with many of the same lenders leading both FHA Streamline and conventional-to-FHA activity. Explore the long-term trend and the lenders behind the growth in our latest analysis: https://t.co/EVRM7b6Z1f
ARMs are back in the FHA refinance market. 📈
Based on the latest FHA endorsement data in our FHA Pivot tool, the adjustable-rate share jumped to 7.2% between Jan–May 2026, up from just 0.2% during the same period in 2025.
See the top 10 FHA ARM refinance lenders driving this shift: 👇https://t.co/YKTx6cco0K