Lewis Hamilton became the driver with most podiums in Formula 1 with 156 Top 3 finishes breaking the record of Michael Schumacher. This Visualization shows his Podiums over the years
#Formula1#SportsVizSunday#LewisHamilton@tableaupublic
Viz : https://t.co/m6Y0gtJQEE
@NammaBESCOM@saphiraslair@NammaBESCOM this is not a satisfactory response. You guys need to have more accountability than this. Everything is dependent on power, there is no water in overhead tank, I cannot use my induction stove to cook. Power cannot be cut for such extended hours
@saphiraslair@NammaBESCOM@NammaBESCOM in HSR Layout, Sector 7, this week on Monday 14th July I did not have power for the entirety of the working day, and today again I have power since before 8AM. Who cuts power on a working day at such hours?
@saphiraslair@NammaBESCOM Every week it’s the same story, unannounced power cuts during working hours, under the excuse of “maintenance”. No power, no water, we can't even run the motor to fill our tank. This is Bangalore, not a remote village. When will this improve? Absolutely pathetic.#BESCOM#powercut
My submission for #WOW2025 Week 8 where we visualize a ratio and a volume on the same chart
Thanks @WorkoutWednsday , @KieranAdair_ and @_hughej for the challenge
viz : https://t.co/kaUSfMKs3l
Lewis Hamilton became the driver with most podiums in Formula 1 with 156 Top 3 finishes breaking the record of Michael Schumacher. This Visualization shows his Podiums over the years
#Formula1#SportsVizSunday#LewisHamilton@tableaupublic
Viz : https://t.co/m6Y0gtJQEE
@sportschord@tableaupublic Thank you! Yes I realised this was a bit confusing, I had selected red for mclaren as their color scheme was grey/red when Hamilton was a part of the team. I guess swapping the colors will make it better
To students starting school today,
Please be nice to your teachers. My dad is 53 years old, and not a whiz w technology. He’s called me EVERY day, attempting to practice because he’s so nervous and wants what’s best for his students.
Please be patient with them. They’re trying.
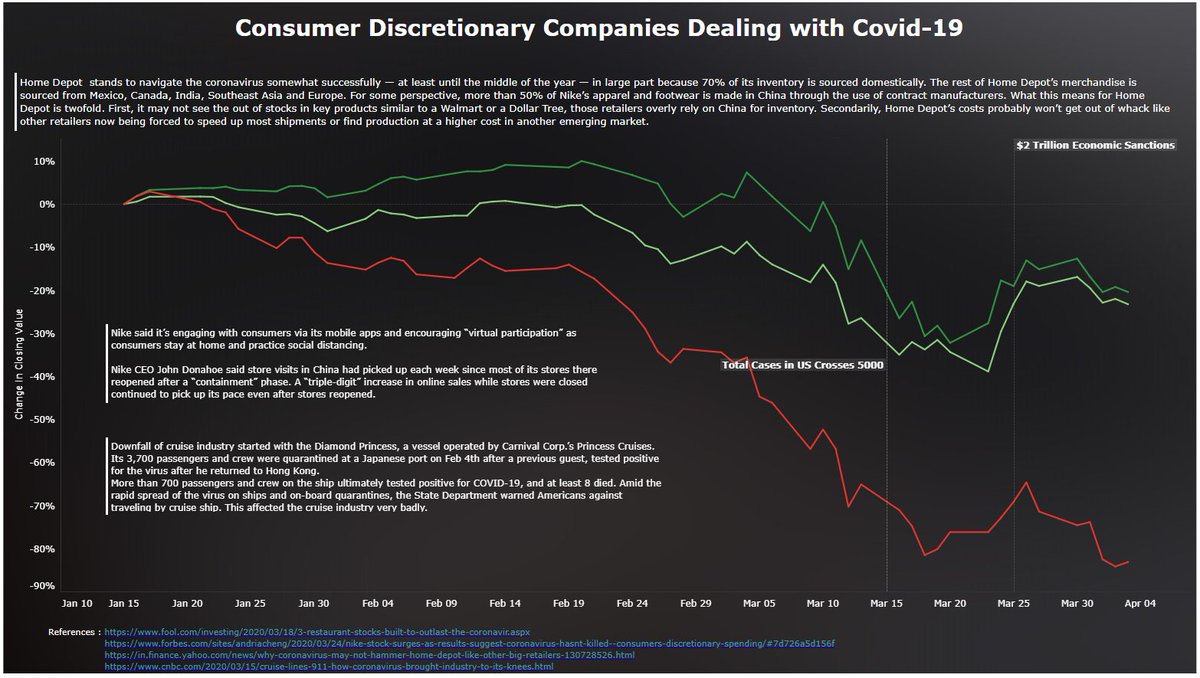
We at @USEReadyInc worked on a few dashboards on the different effects of COVID-19. I had created this dashboard on impact of COVID-19 on US Stock Market back in April.
#Tableau#dataviz@tableaupublic#StockMarket
Interactive Viz : https://t.co/cMITj1YfQL