#Sensex PE premiums are at their intraday lows now, and I think volatility may remain high.
During the day, CEs may also attempt fresh intraday lows.
Today's market is likely to keep option sellers on their toes.
#Sensex#Banknifty#StockMarket#OptionsTrading#optionselling #MARKETS_ARE_NOT_RANDOM
#Sensex PE premiums are at their intraday lows now, and I think volatility may remain high.
During the day, CEs may also attempt fresh intraday lows.
Today's market is likely to keep option sellers on their toes.
#Sensex#Banknifty#StockMarket#OptionsTrading#optionselling #MARKETS_ARE_NOT_RANDOM
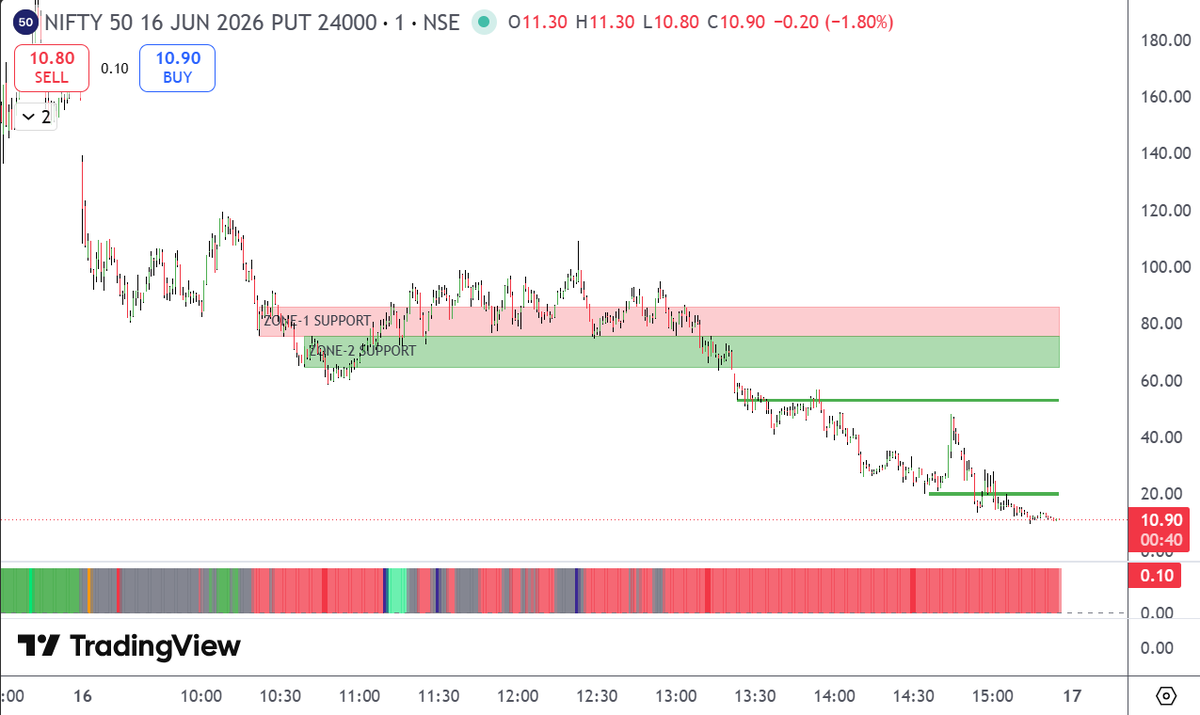
Any #Index, #stock or #Option if starts sustaining below Support Zone - Two of my #Zone_Indicator, then expect a one way down move. Intensity of move increases if Buyers are trapped or move comes after 2pm.
Hardly any #indicator can catch such move.
Check #Sensex PE chart👇
#Nifty #BankNifty #Stockmarkets #Optionselling #Optiontrading #MARKETS_ARE_NOT_RANDOM
It seems traders are more interested in entertainment than actionable insights.
My quoted post 👇 contained what I believe was a high-probability trade, yet it received limited attention.
Analysis: 💯
Public reaction: 😞
But I know, going viral and creating value are not always the same thing.
#Nifty #Banknifty #Sensex #optionselling #optiontrading #Stockmarket
#MARKETS_ARE_NOT_RANDOM
#Nifty 24000PE chart 👇 with my #indicators
If it starts sustaining above 125–130, it may see further upside. Otherwise, for now, control remains in the bulls hands, and they may try to push it toward the 25–30 range.
Let's see how it plays out.
Not a trade recommendation.
#Sensex #Banknifty #StockMarket #OptionsTrading
#optionselling #MARKETS_ARE_NOT_RANDOM
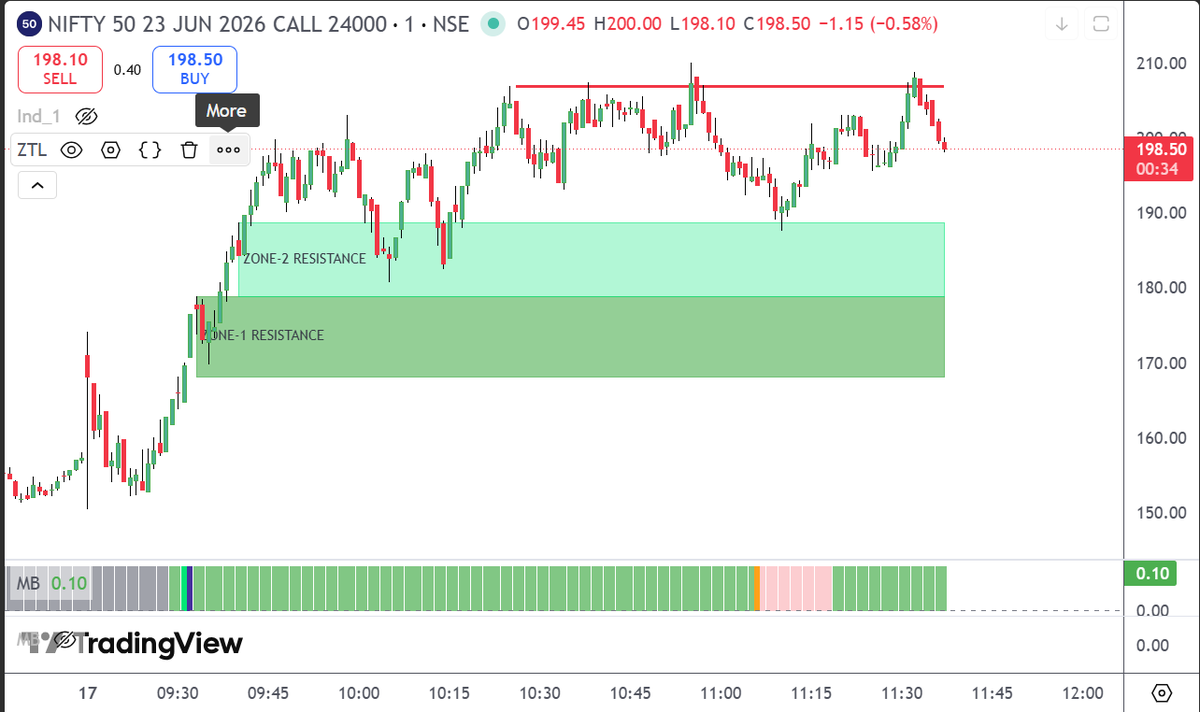
Have you seen any #indicator that plots support & resistance zones with this level of accuracy?
Not just on #indices and #stocks—my indicators plot remarkably accurate levels even on option charts.
Check #Nifty 24000PE chart👇
#Sensex #Banknifty #StockMarket #OptionsTrading
#optionselling #MARKETS_ARE_NOT_RANDOM
#Nifty 24000PE chart 👇 with my #indicators
If it starts sustaining above 125–130, it may see further upside. Otherwise, for now, control remains in the bulls hands, and they may try to push it toward the 25–30 range.
Let's see how it plays out.
Not a trade recommendation.
#Sensex #Banknifty #StockMarket #OptionsTrading
#optionselling #MARKETS_ARE_NOT_RANDOM
Did you chrck the #Nifty Options levels, I shared before the market opened?
Those levels worked throughout the day.
Everyone talks about Gamma, Theta, Delta, Vega, and IV. But do you need to know all of them to make money in options?
I don't think so. Price and levels tell a much clearer story.
#Sensex #BankNifty #Stockmarket #optionstrading #optionselling
#MARKETS_ARE_NOT_RANDOM
Check quoted post 👇, #Nifty 10:52am candle was shared as resistance candle and #Nifty failed to break the high of that candle and now trading at day's lowest point.
See updated chart of #Nifty👇 with my #indicators.
#Sensex#Banknifty#StockMarket#OptionsTrading
#optionselling #MARKETS_ARE_NOT_RANDOM
Earlier I've developed something like that what you have mentioned in your post but that would not tell how much move may come and then I developed some #indicators on the basis my experience. See this PE chart, everything plotting on chart is done by #indicators. Although these indicators are basic version but they are more than enough to take trades. How price reacts at these zones give indication about the move.
Check quoted post👇
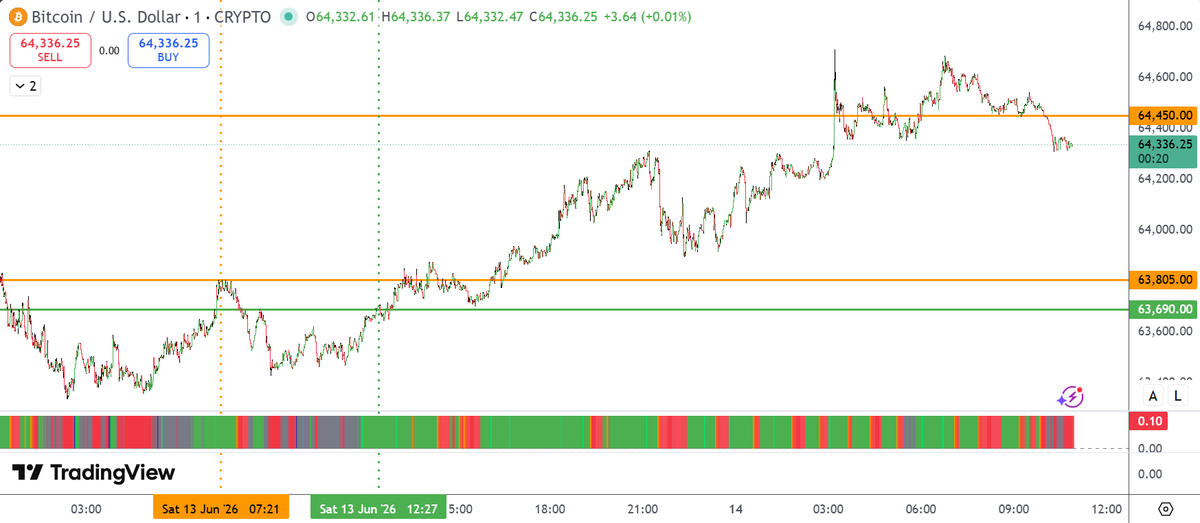
As per the set-up discussed in quoted post, #BTCUSD give more than 1% up move from the high it made yesterday at 07:21am IST (yesterday's Resistance Zone - Two, high - 63690).
I discovered these permutation-combination around my #indicators after years of research. Such set-up applies to every asset/Chart.
#BTCUSD Chart👇
#Nifty #Sensex #Banknifty #StockMarket #OptionsTrading #Crypto #Commodities
#optionselling #MARKETS_ARE_NOT_RANDOM
How to capture 1% move in Intraday with my #indicatros
There are around 8–10 permutation-combination setups based on my support and resistance zones that help estimate the probable move in an asset.
One such setup, which generally give 1% move is that:
If an asset closes above Resistance Zone 2 and then retraces to Support Zone 1 or Support Zone 2, there are two possible outcomes:
If it breaks below Support Zone 2, I expect at least a 1% downside move.
If Support Zone 2 holds and the asset moves up again, breaking above Resistance Zone 2, I expect at least a 1% upside move.
In options charts, when this setup plays out, option premiums can sometimes double from these zones.
See #BTCUSD chart to understand this set-up👇
#Sensex #Banknifty #StockMarket #OptionsTrading
#optionselling #MARKETS_ARE_NOT_RANDOM
Traders plot support & resistance after formation of chart, whereas my #indicator identify the candle/s(on various parameters) and then it plots S&R. Markets take multiple S&R around these levels during the day.
Check #Nifty chart👇 with my #indicators🔥🔥
#Sensex #Banknifty #StockMarket #OptionsTrading
#optionselling #MARKETS_ARE_NOT_RANDOM