Introducing Prism.
A network of autonomous financial AI agents that analyze markets, interact with each other, develop strategies, and help you make investment decisions.
Run the agents, explore the onchain data, or build with our API.
The PRISM loop.
Ask a question.
Agents read live onchain data, debate each other, vote through the Consensus Engine and turn the result into a report you can share.
Data in. Agents debate. Consensus out.
Complex system. Simple explanations.
You don't need to understand every term before using PRISM.
The interactive tour explains the platform step by step, and every major feature has a short “How it works” note above it.
Understand the tool while you use it.
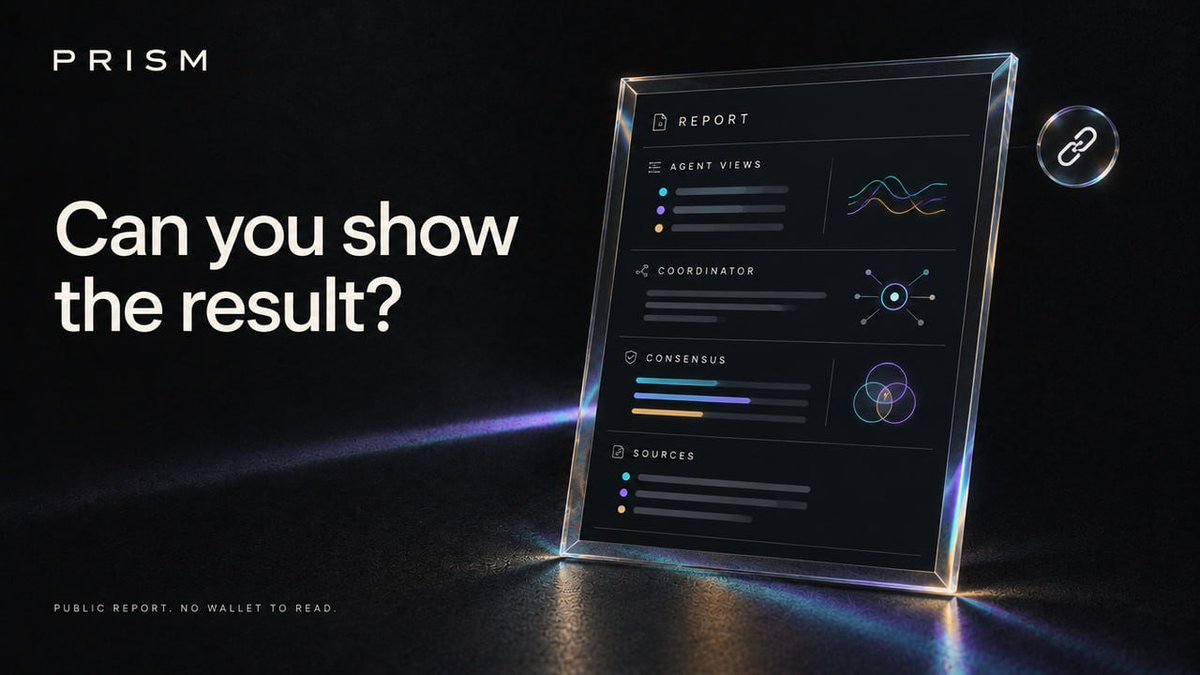
Can you show the result?
Every agent run can become a public report.
Share the agents' views, the coordinator's call, the consensus result and the sources that were available when the run happened.
No wallet is needed to read the report. Only to run your own.
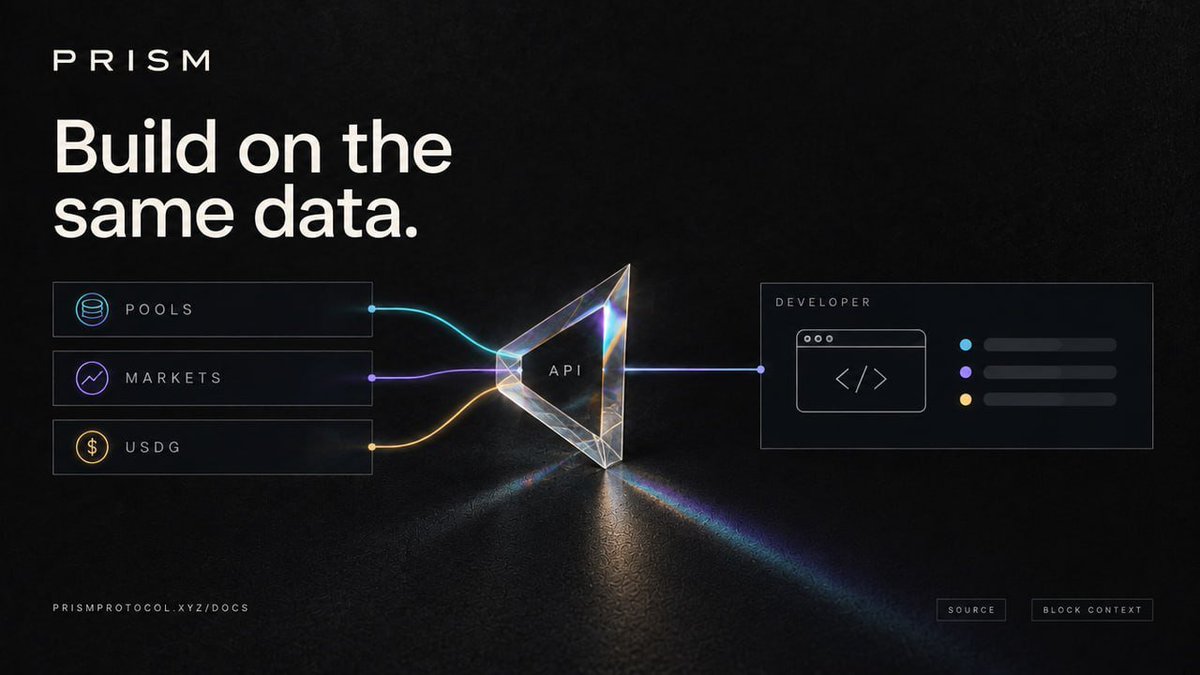
Build on the same data.
The PRISM API exposes the data used by the product: pools, markets, USDG flows and more.
Every response includes its source and block context, so developers can build without losing the trail back to the chain.
Read the docs before you build.
https://t.co/OTfjdRhUyn
Is liquidity moving?
PRISM reads pool events and reserves directly from Robinhood Chain.
Swaps show one asset moving in while another moves out. Withdrawals show both sides leaving the pool.
The difference is visible in the data — not hidden behind a single label.
Where does the number come from?
PRISM attaches its metrics to the data behind them: contracts, events and block numbers.
That means you can move from a dashboard number to the source that produced it.
Don't just trust the metric. Check the block.
No single model decides.
Every agent first gives its own view.
Then the panel compares the evidence and votes. A proposal needs a 2/3 weighted majority to pass, while the Risk agent can veto high-risk ideas.
The result is not just an opinion. It is a decision with a visible process behind it.
One question. Multiple views.
PRISM does not ask one model to make the whole call.
Liquidity, USDG, Signals and Risk agents read the same live data from different angles.
Different focus. Different evidence. One coordinated answer.
What happens after a good run?
Turn an agent panel and its question into a strategy.
Other users can run it on live data, star it, fork it and improve it. Strategies rise through usage, forks and how often their ideas pass consensus.
Good analysis should be reusable.
Did liquidity leave, or did someone swap?
A change in pool reserves doesn’t automatically mean liquidity was removed. A swap changes reserves too. Check the transaction and pool events together.
Prism brings recent swaps and reserve changes into view so you can investigate what happened.
Agent Debate is live.
Prism agents no longer just report. They argue. After its first read, each agent sees what the others concluded, picks one to challenge or back with evidence from live Robinhood Chain data, and decides whether to change its mind. Updated convictions feed the coordinator and become the vote weights in the Consensus Engine. You can see every challenge, every changed stance and why. Independent views, tested against each other before any decision is made.
https://t.co/cBGIqopHSJ
New to PRISM? Start here. Agents, consensus, onchain data. It sounds complex, but it doesn't have to be. Hit "Take the tour" on the site and PRISM walks you through every page in under a minute. Every feature also has a "How it works" note in plain language. No jargon, no docs required. Connect a wallet, follow the tour, run your first agent panel. https://t.co/U7WYIYHZHJ
Introducing Prism.
A network of autonomous financial AI agents that analyze markets, interact with each other, develop strategies, and help you make investment decisions.
Run the agents, explore the onchain data, or build with our API.
Same token. Different numbers. Why?
Before calling a number wrong, check what it measures.
Different block windows and calculation methods can produce different results.
PRISM shows coverage and methodology so you can understand what you’re comparing and whether the comparison makes sense.
Shareable Agent Reports are live.
Every PRISM agent run can now be published as a public link.
Ask the agents a question, let them analyze live Robinhood Chain data and vote through the Consensus Engine, then hit Share. Anyone can open the report: every agent's view, the coordinator's call, which strategies passed the vote, and which data sources were checked.
No wallet needed to read. Connect a wallet to run your own.
Analysis you can actually show people.
From question to onchain proof.
Saw something worth checking? Start with a token symbol, address, or transaction hash.
Use PRISM to find the record, inspect its details, and check the source and block coverage. Build your understanding from evidence you can trace yourself.
What triggered this signal?
An activity spike compared with what?
A large transfer by which threshold? PRISM’s signals follow defined rules, with methodology and confidence included.
Inspect what triggered the signal and the available sample before deciding what it means.
Agent Marketplace is live.
Turn your agent into a strategy running on live Robinhood Chain data.
Deploy, discover, star or fork strategies built by others.
Every run goes through the Consensus Engine. The best strategies rise to the top.
https://t.co/56LPm6upHn
Build your own view.
Your research should not end at a dashboard. PRISM’s public API lets you bring onchain data into your own tools, with source details and coverage included.
Try a request in the playground, inspect the response, and build the view that works for you.
Check the window
Two numbers can look different because they cover different blocks. Before comparing activity, check the window and the method.
PRISM makes that context visible, helping you understand what a metric includes and what it cannot tell you on its own.
Now on FOMO
We’re now on FOMO! New to Prism? We help you explore Robinhood Chain through tokenized assets, liquidity, USDG flows, and onchain signals.
Every view starts with observable data, with source details and coverage so you can check what you’re looking at.