June 2026 4H Chart Analysis
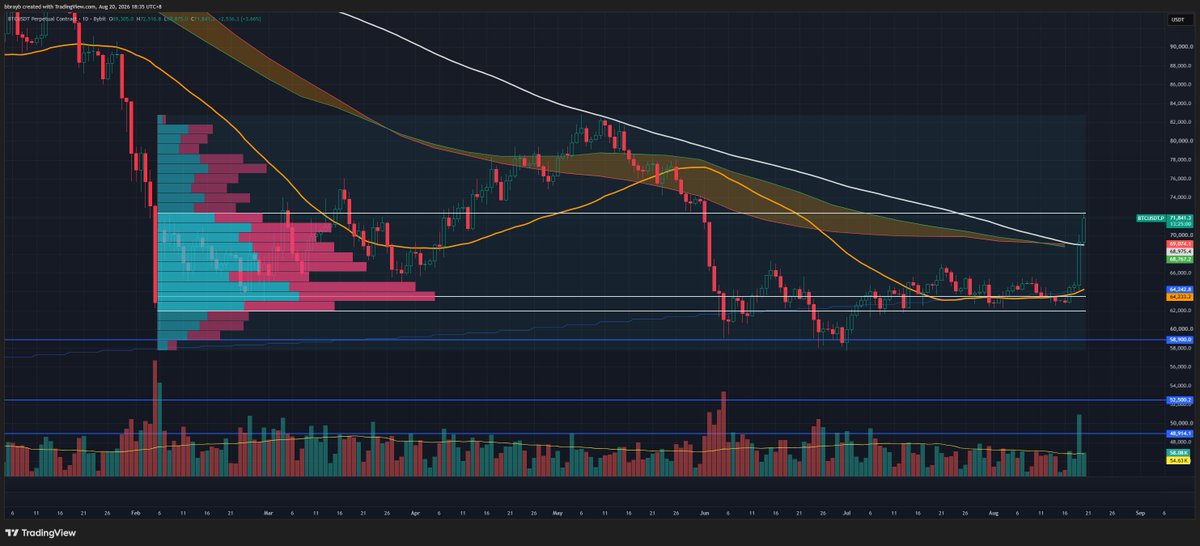
Horizontal Channel / Range-Bound: Price has been trading in a clear sideways range for most of June, bouncing between roughly $58k – $67k (the blue box area you highlighted).
13% Volatility: From the low (~$58k) to high (~$67k) is indeed about 13–14% range — typical for a consolidation phase after the bigger drop from $84k.
$1,000 Sweep of the Low: The wick below $60k down to ~$58k (and the recent test) is still within the monthly trading range. It’s a liquidity sweep rather than a breakdown of the broader June range.
What This Means
Short-Term:
The market is in a range-bound consolidation on the 4H timeframe.
The repeated tests of the lower boundary ($58k–$60k) with buyers stepping in show the range is holding for now.
This kind of chop is common after a sharp correction — the market is digesting the move and waiting for a catalyst.
Bigger Picture:
On higher timeframes (daily/weekly), the overall structure is still corrective (lower highs since the $84k high).
The June range is just a pause inside that correction, not yet a reversal.
True Range Bounce: Yes — June has been a range bounce with high volatility but no clear directional breakout. The $1,000 sweep of the low is still contained within the monthly range, so the range structure remains intact until we see a decisive break either above ~$67k or below ~$58k.
Trading Implication if you on Long
$59.5k is near the lower end of this range — a reasonable spot for a range trading bounce.
Next Key Levels:
Resistance: $62.4k – $63k (first target for partial profit)
Strong Resistance: $65k – $67k (top of the range)
Support: $58k – $59.5k (if broken, range fails)