Merz verläßt bei Weidels Rede fluchtartig den Saal, das zeugt davon daß er genau gewußt hat was kommen würde. Tja die Wahrheit tut manchmal mächtig weh.
$20,000 FUNDED GIVEAWAY
Win a FREE Automated FUNDED Entry account.
→ $500 FUNDED from day one
→ Scale all the way to $20,000
→ Automated trading
→ Keep 70% of profits
To enter:
→ Follow @FoxifyTrade
→ Like & repost this post
→ Tag 2 traders below
48 hours. One winner.
Ends: Thurs Oct 8 at 16:00 UTC
Good luck!
@PythNetwork 5Which traditional financial institutions are already paying for Pyth Pro, and what does the pipeline look like?
6How does Pyth plan to win market share from Chainlink in institutional market data?
@PythNetwork 3Why does a customer need to hold or buy PYTH? Are there plans to require PYTH for data payments or staking for data access?
4With the main token unlocks finished, how much supply from team and early investors can still realistically hit the market?
@PythNetwork 1What's the current ARR of Pyth Pro, and how realistic is the $500M ARR target? What's the timeline?
2Are there plans to increase the PYTH Reserve buyback beyond 33% of the treasury, or to burn bought-back tokens instead of holding them?
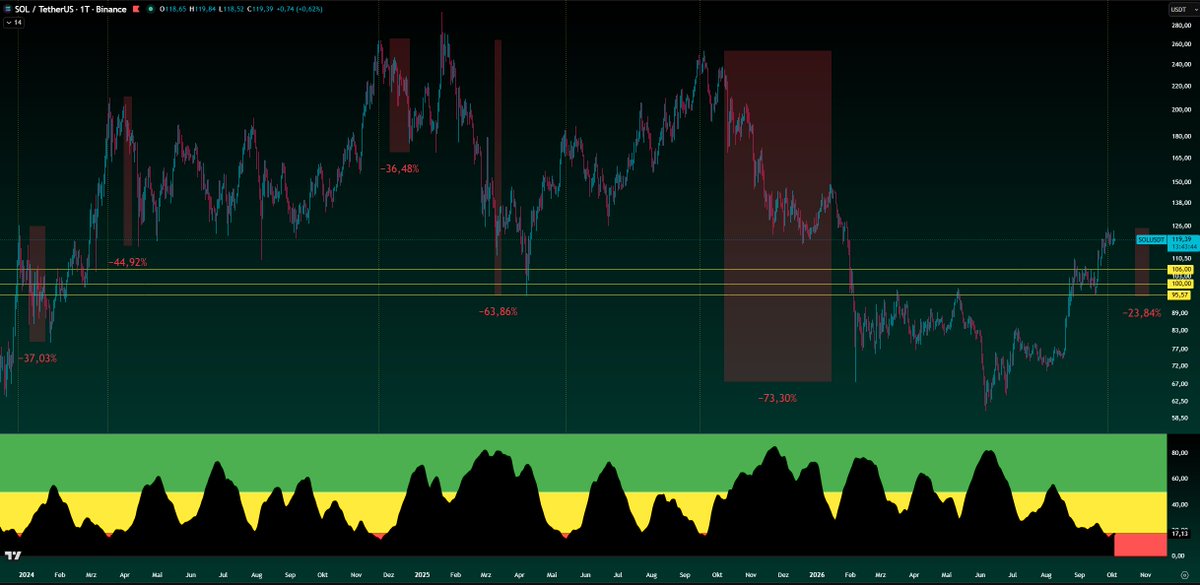
Measured from the last candle in the blue TEM zone, Solana needed 17 days back then until it first touched the yellow zone.
After that it found its last local bottom 71 days later. From the last candle in the green TEM zone it then took 39 days to the top, and that was roughly 68%.
We’re seeing the exact same setup in 2026.
Candle in the blue TEM, 21 days later the first touch of the yellow zone. After 66/69 days came the local bottom and from the last green TEM candle we’re up around 68% again.
All in all it’s 110–111 days from the last relevant TEM zone to the top.
SOL entered also the overheated zone on the higher timeframe, a rare sign that SOL is about to see a huge correction.
The second picture starts from 2023 and ends in 2026.
solana:So11111111111111111111111111111111111111112
Measured from the last weekly candle inside the green zone of the TEM, ETH found its peak within 35 days.
The top occurred exactly after 35 days (on the weekly timeframe), and the attempt to break out that week resulted in a lower high.
The first level I see for Ethereum is $2,500, with a maximum pullback to $2,200.
I expect market weakness over the next two weeks and for Bitcoin to drain liquidity from most altcoins.
I also showed patterns for Solana and Bitcoin that predicted the tops.
As long as it hasn't been invalidated, it remains valid.
Could it be that simple?
ethereum:native
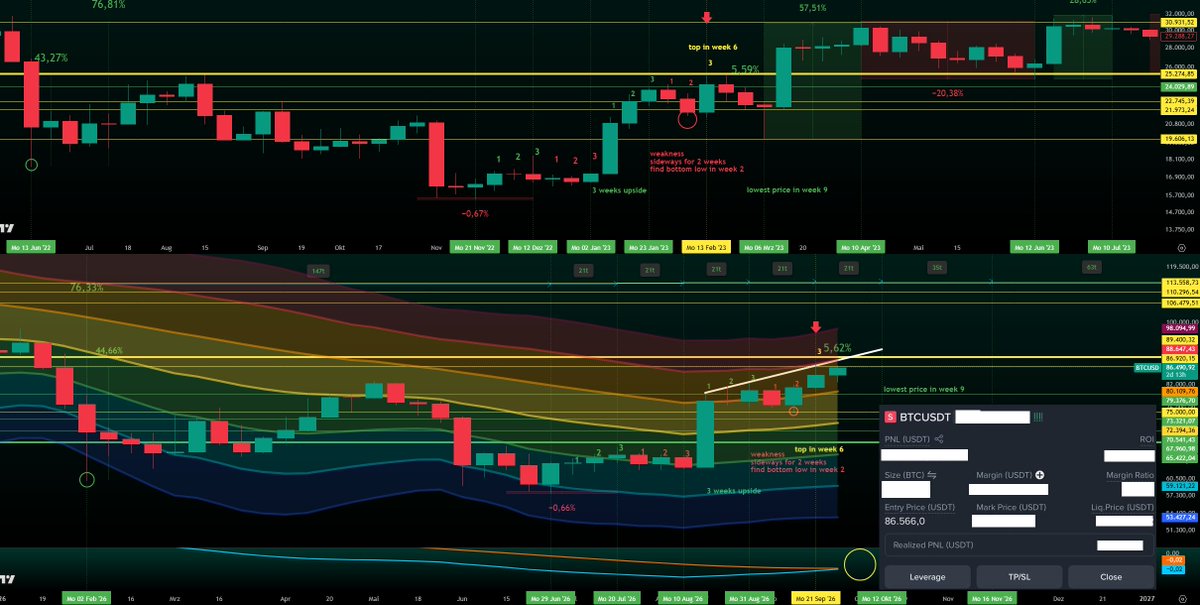
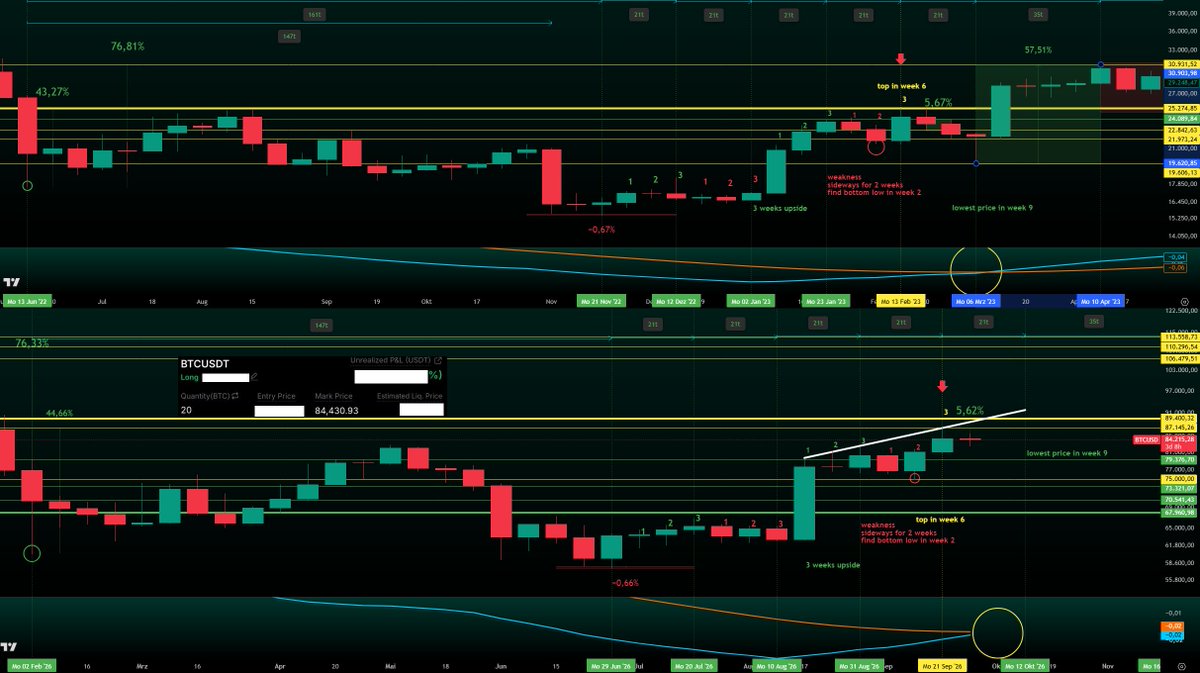
Bitcoin rejected after a 5,6% pump, exactly like 2023.
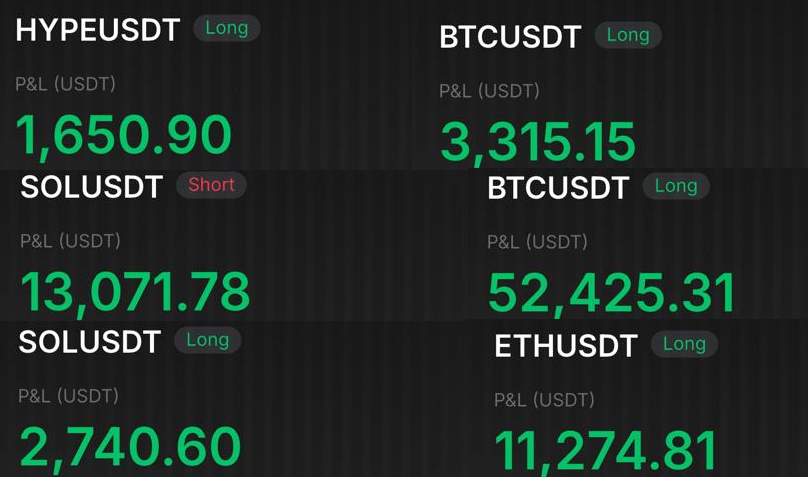
A clear reason for me to enter the short trade and close my long positions.
I am very bullish and i will start to build my swing long position soon, because i expect the bullish crossover between 5.10 and 12.10. ⌛️
Clean entry, clean exit.
Do not miss any live trades and join XAPA's WORLD
https://t.co/6atyr1dSg7
bitcoin:native
The HTF weekly pattern has played out exactly so far. Drawdowns are clearly smaller, so I don’t expect Bitcoin to go below $75,000.
I’m extremely bullish, but rational!
First the area around $87,000 has to be taken.
Once that’s done, the path almost inevitably leads toward $89,000, with momentum up to $91,000, where I expect a rejection.
Once that happens, I expect the low in the week 9.
A higher high above $87,300 would completely change the read on this pattern and would have to be treated differently.
After all this unnecessary noise, Bitcoin will rise toward $100,000 and print a new all-time high by next year.
I’ll close the 20 Bitcoin long between $87,000 and $89,000.
The chart says more than 1,000 words.
Every dip is an opportunity, a serious one.
This is a gift for our future. 🌹
bitcoin:native