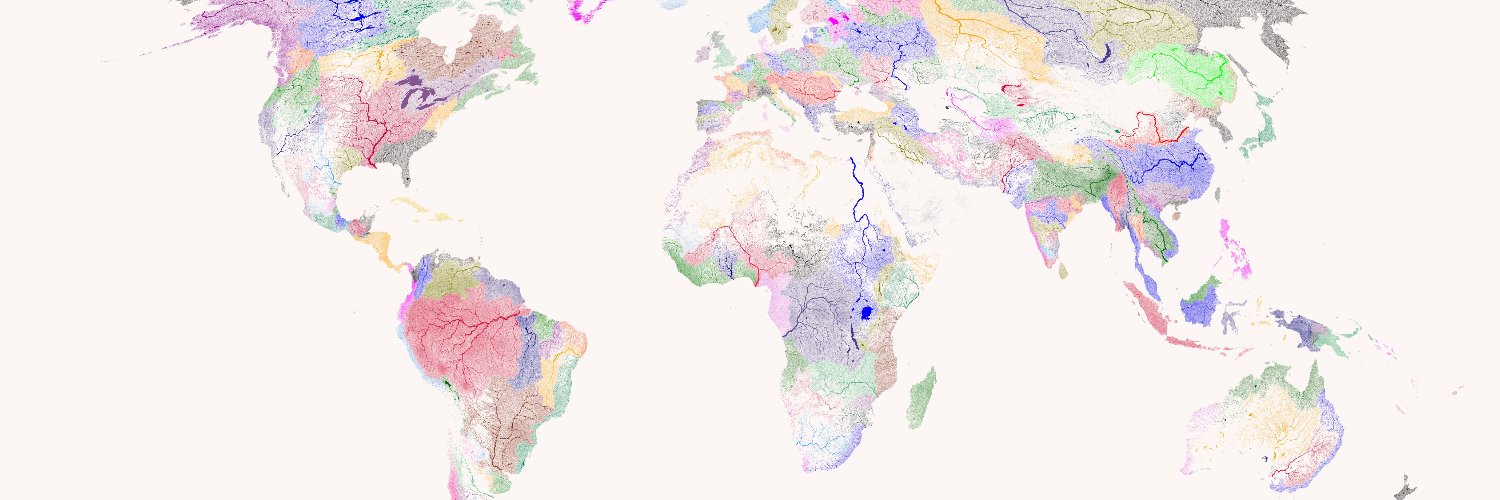
This bivariate map uses WRI's Aqueduct 4.0 data to show projected gross water demand (white→orange) vs. blue water availability (blue→purple) under a business-as-usual scenario by 2065–2095.
This bivariate map uses WRI's Aqueduct 4.0 data to show projected gross water demand (white→orange) vs. blue water availability (blue→purple) under a business-as-usual scenario by 2065–2095.
This bivariate map uses WRI's Aqueduct 4.0 data to show projected gross water demand (white→orange) vs. blue water availability (blue→purple) under a business-as-usual scenario by 2065–2095.
For those who care - projection is EPSG:27703 is WGS 84 / Equi7 Asia
This bivariate map uses WRI's Aqueduct 4.0 data to show projected gross water demand (white→orange) vs. blue water availability (blue→purple) under a business-as-usual scenario by 2065–2095.
Inspiration came from this post from @Esri - https://t.co/APHofHWuYe
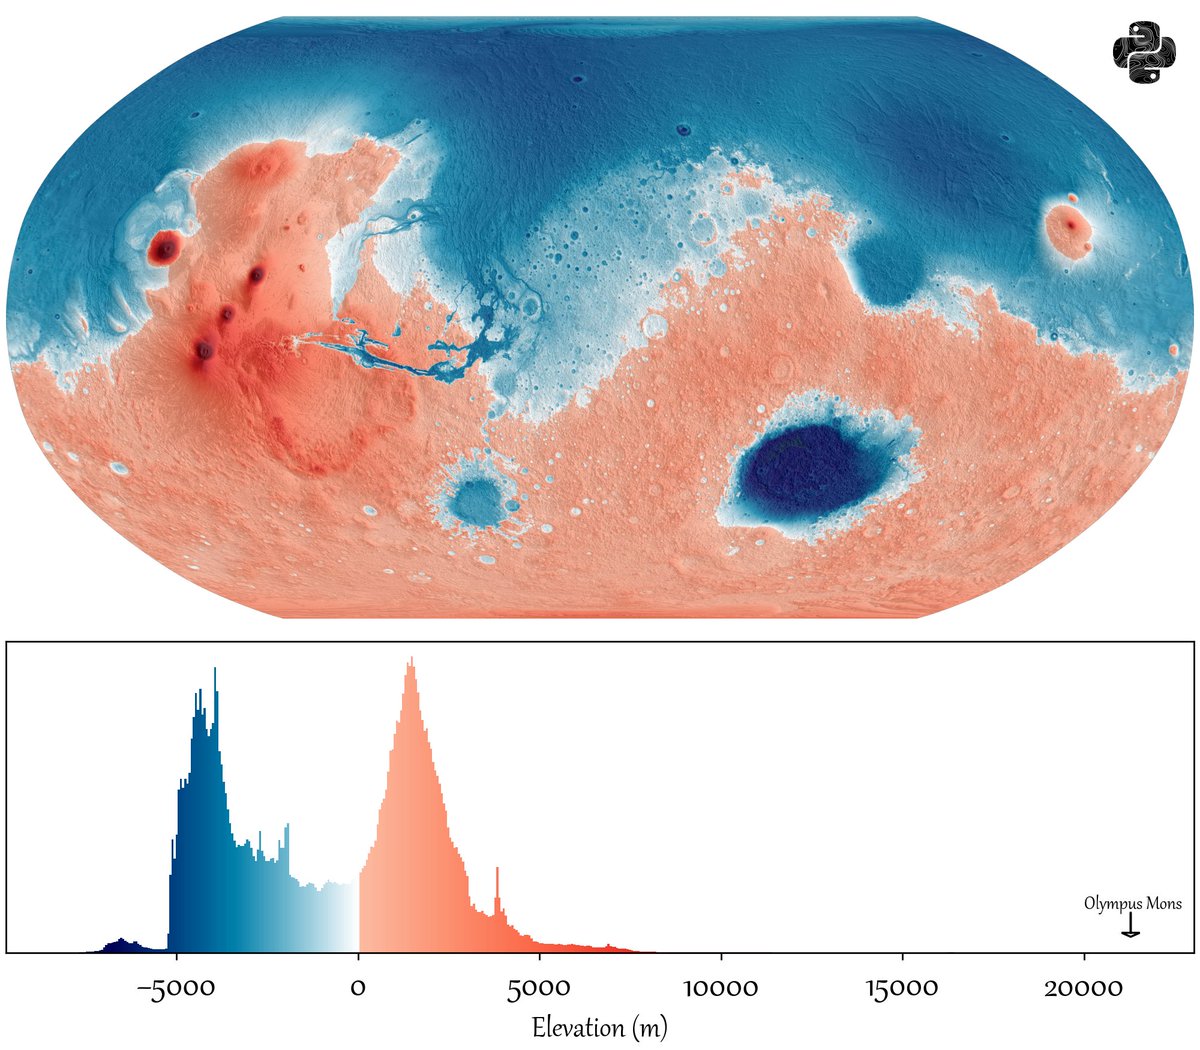
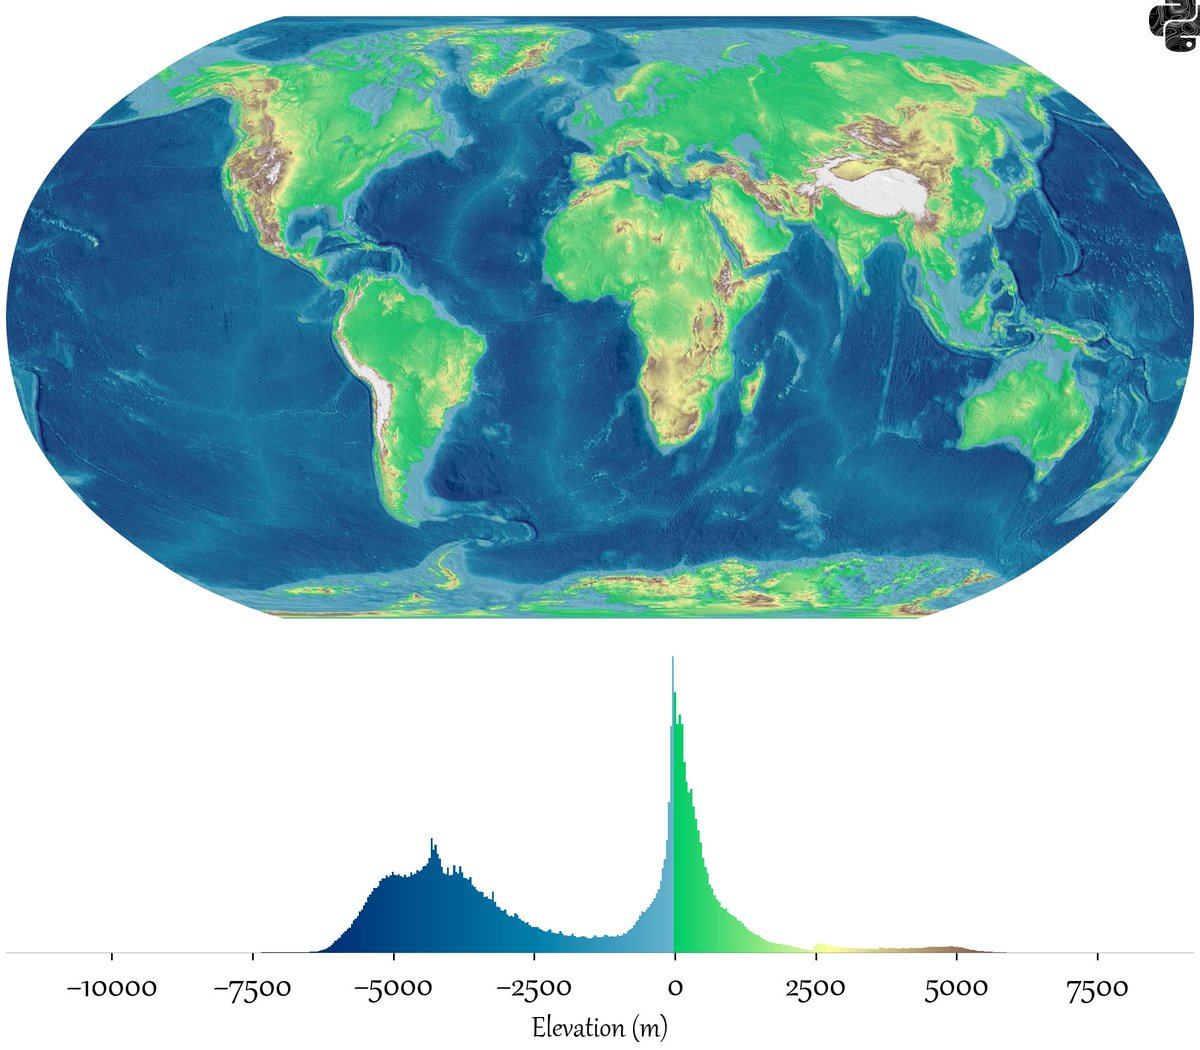
I made this map for Earth last week and you seemed to like it so here is it for Mars, the distribution of elevation levels on the earths surface. I have used a blue-red colourmap to give it the illusion of oceans. Negative values indicate terrain below the Mars areoid — a gravitational reference surface defined where atmospheric pressure equals 610.5 Pa (the triple point of water) — which serves as the zero-elevation datum in place of a sea level.
I made this map for Earth / Mars last week and you seemed to like it so here is it for Venus showing the distribution of elevation levels on the surface. Negative values indicate terrain below the Mars areoid — a gravitational reference surface defined where atmospheric pressure equals 610.5 Pa (the triple point of water) — which serves as the zero-elevation datum in place of a sea level.
I made this map for Earth last week and you seemed to like it so here is it for Mars, the distribution of elevation levels on the earths surface. I have used a blue-red colourmap to give it the illusion of oceans. Negative values indicate terrain below the Mars areoid — a gravitational reference surface defined where atmospheric pressure equals 610.5 Pa (the triple point of water) — which serves as the zero-elevation datum in place of a sea level.