@DillyDreamsBig@wexfordcoco Don't worry too much, that app is basically guessing. They don't have sensors, that is the output of a model. Poor air quality is mostly down to domestic fires and low winds.
Due to technical reasons, and the overall yikes of this platform this account isn't going to do anything else here, but it is on Bluesky at https://t.co/dW8iSe2laM where automatic alerts and weekly leaderboards will resume.
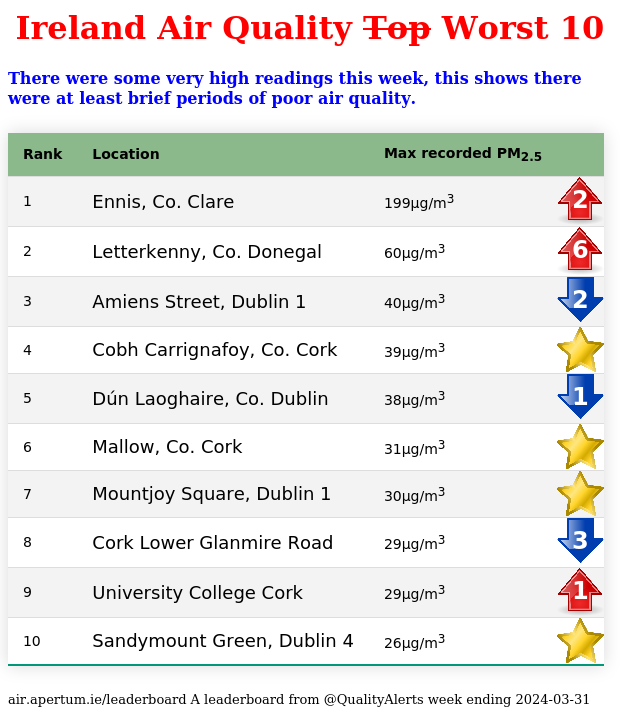
not a full week, but since I fixed the technical issue you can see this is a summer leaderboard. People are not burning stuff in the evenings, so the air is great (note this is *peak* values, the average is super low)
The process uses something called Flask, which connects to a mysql server and that connector needed an update, so I updated it. https://t.co/2BX1bPO0Am
Leaderboard has been broken for a bit, as has the process that gathers data for the annual profiles. Should be back working in a week or so (need a week of data for the leaderboard)
I updated the server, and it all broke, when I got round to a deeper investigation I found that one open source module had been broken by an update to another, which is a bit of a problem, but as it is open source the solution is at hand.
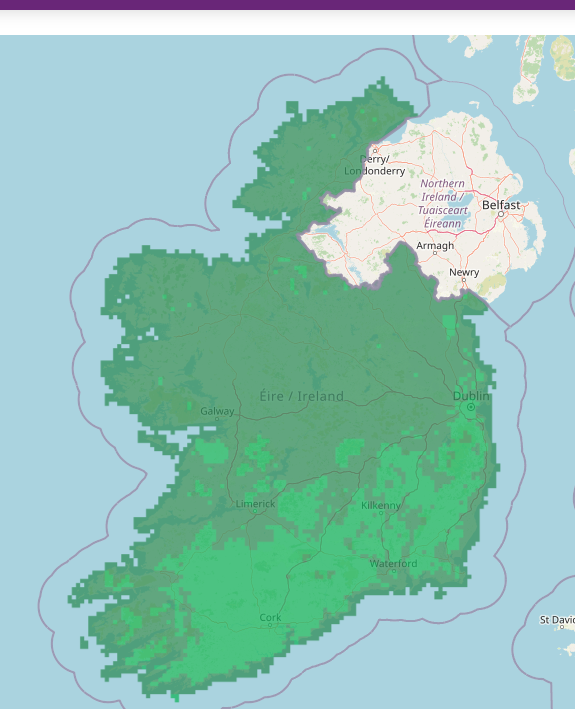
The EPA recently launched an hourly updated Air Quality Index for Health (AQIH) map. The AQIH ranks the amount of air pollution in the air from 1 to 10. The map provides you with air quality information to help you plan your day and protect your health https://t.co/Aq1nxflQgj
I have PM10, NO2 and O3 as well. I just can't see how they are in any way predictive of the observations that are measured, or add any value at all really. Shame, as it is good in principle to forecast things so that action can be taken.
Back in September the EPA started doing forecast maps of air quality on https://t.co/bDoIfxNtvh Fancy stuff. I expect you are wondering what would happen if someone grabbed a picture every day and made them into a video.
When we do get the first week of the year with all sites recording a peak PM2.5 particulate reading of less than 100 I will do some year on year calculations to see if we can see any impact of the fuel regulation changes.
Here is that Letterkenny peak as a 24 hour profile, you can see it is over multiple hours with the characteristic shape of the evening burn - being added to what is really very good daytime air.
Leaderboard time. Donegal had a bad, but real looking Saturday, but apart from that we are seeing many more places peaking below 100 as we start to exit the burning season.
The EPA started producing national air quality forecasts a while back. I thought it might be nice to see them as a video to spot seasonal patterns, here are all the AQIH forecasts as a video. Not entirely clear how informative this was as an exercise!