A personal note: Please bear with me if I'm unable to post regular updates. I'm building, coding, developing and maintaining this system on my own, and there's a lot of work behind each overview.
I'm keen to review and understand the results myself before sharing them, rather than simply automating the process and publishing whatever comes out. Perhaps I'm still a little old-school when it comes to relying on automated or AI workflows, but for now, I want to be confident in what I'm putting out there.
I'd rather share something I've taken the time to check and understand than post more frequently at the expense of quality. Thank you for your patience as I continue developing the system.
Crypto Market Update | 2 November 2026
$BTC $ETH $SOL $BNB $XRP
Bearish pressure, but no broad volatility expansion
Across BTC, ETH, SOL, BNB and XRP, the signals point to a predominantly bearish directional environment.
What stands out:
Direction: All five assets have a DOWN bias, with sellers holding the advantage.
ADX: Trend momentum is positive across all five, indicating strengthening directional pressure. However, the strength of that trend varies.
ATR: None of the five assets currently shows ATR expansion. Volatility is not broadly accelerating.
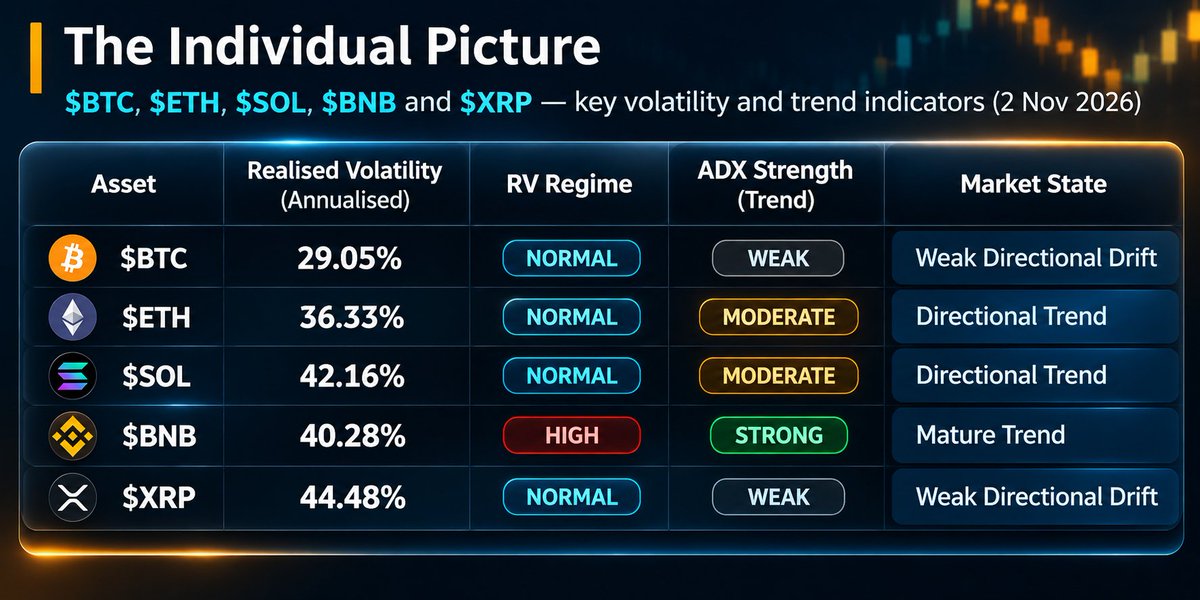
Realised volatility: Four assets remain in the NORMAL regime. BNB is the exception, at the 86.7th historical percentile and classified HIGH.
(see image attached for The individual picture)
My interpretation:
This is not a picture of broad volatility expansion. Instead, sellers retain directional control, while ATR expansion remains absent across all five assets.
BNB is the most developed bearish trend in this group, but its volatility is no longer expanding. BTC and XRP show considerably weaker directional conviction.
The distinction matters: a directional bias does not automatically mean an attractive trading opportunity.
Methodology: Realised volatility is annualised and calculated from close-to-close returns. RV percentiles and regimes are assessed against historical observations. ATR expansion is evaluated using the recent ATR slope against a robust historical baseline. ADX measures trend strength; +DI/-DI determines directional bias. Market-state labels combine these inputs. All readings reflect the supplied 2 November 2026 snapshot.
One important analytical point: ADX momentum is positive for all five assets, but ADX acceleration is negative for four of them. This means trend-strength momentum is still positive, although its rate of increase is easing in BTC, ETH, BNB and XRP. SOL is the exception, with positive acceleration too.
Python-generated · 1Y daily OHLCV · 30-observation statistical context · Descriptive, not predictive. Using daily - latest closed 2 Nov data from Binance.
Data clarification: A question has been raised regarding potential differences between the daily closing prices used in this analysis and those reported by other sources.
The data currently uses Yahoo Finance's daily session dates. I am reviewing the closing-time alignment to establish whether the daily prices should be matched to a different market-session closing convention.
The analysis is being checked, and I will clarify the methodology and update it if necessary. Thank you for raising this point.
Before and after the Binance security incident on 29 October. Observing changes in volatility, directional pressure and broader market participation. While the timing provides an interesting point of comparison ( not claiming direct causation ). https://t.co/otTNfEyRJo
Data clarification: A question has been raised regarding potential differences between the daily closing prices used in this analysis and those reported by other sources.
The data currently uses Yahoo Finance's daily session dates. I am reviewing the closing-time alignment to establish whether the daily prices should be matched to a different market-session closing convention.
The analysis is being checked, and I will clarify the methodology and update it if necessary. Thank you for raising this point.
Crypto Market Update | 31 October
Did market conditions change around the Binance security incident?
I compared the latest readings with the 27 October snapshot.
📊 What stands out?
• BTC DVOL: 39.38 — 83.5th percentile
• Realised volatility increased across all 5 assets
• ATR expansion detected in 4/5
• All 5 show DOWN DI direction
• BNB RV reached the 90th percentile
But the macro picture remains defensive:
BTC IV/RV: CALIBRATED
Volatility risk: LOW
Macro risk engine: RED
Strengthening stablecoin dominance remains the main warning signal.
The timing makes this comparison interesting, but the data does not establish that the Binance incident caused these changes.
More volatility does not necessarily mean stronger market participation.
#Bitcoin #Crypto #MarketAnalysis
See the article for more details.
Thanks for the feedback. I'm investigating this, and my initial findings suggest that I need to review the daily closing-time alignment. The data currently uses Yahoo Finance's daily session dates, and I am checking whether the closing prices should instead be aligned to a different market-session closing time. I'll clarify this and update the methodology accordingly. Appreciate you raising it.
Article I shared on the 12th October has combined news with a 30 day stat analysis. Here I have another approach to compare 30/60 day comparison.
Your comments on what you find more useful will help my research and development process, and in return I will be able to provide you better tailored data analysis.
Commodity Positioning | 30-Day vs 60-Day CME Open Interest Analysis
Yesterday I posted a shorter statistical window , which can identify changes that stand out against recent market conditions. A longer window provides a broader reference and can reveal whether those changes are unusual beyond the immediate period.
Here I am I comparing the same five commodities using 30-day and 60-day rolling reference windows, to look at:
How unusual are the latest changes in commodity open interest? What changes with the longer window?
$COPPER
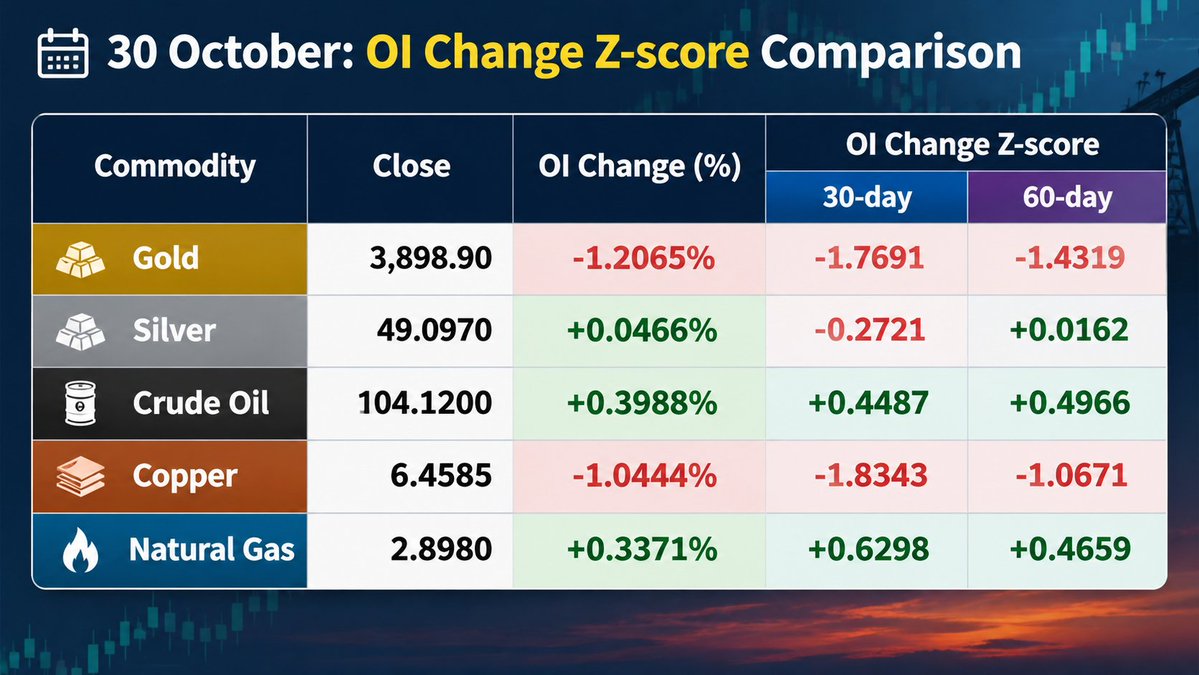
The latest 1.04% reduction in OI stands out more against the 30-day baseline (-1.83) than the 60-day baseline (-1.07).
The reduction is unusual relative to recent activity, but less unusual when compared with the broader period.
$GOLD
The 1.21% reduction in OI also remains relatively unusual against both windows. The 60-day reading (-1.43) is less negative than the 30-day reading (-1.77), but the signal is still worth monitoring.
$SILVER
The 30-day reading is slightly negative (-0.27), while the 60-day reading is almost neutral (+0.02).
This suggests that Friday's small OI increase was broadly normal against the longer reference period, despite the substantial price decline.
$CRUDE ($OIL)
The readings are almost identical (+0.45 and +0.50). The latest OI increase was not particularly unusual against either baseline.
$NATGAS
Both readings are modestly positive (+0.63 and +0.47). The latest OI increase was also relatively normal against both reference periods.
Why use two windows?
The 30-day window is more responsive to recent changes in market activity. The 60-day window provides a broader comparison and reduces the influence of shorter-term fluctuations.
Neither is inherently better in every situation. They answer slightly different questions:
30 days: Is this change unusual compared with recent market behaviour?
60 days: Is this change unusual compared with a broader period of market behavior?
The wider market picture
The comparison highlights an important distinction: a price movement can be substantial without being accompanied by an equally unusual change in open interest.
Silver's sharp decline, for example, occurred while Friday's OI change was close to normal against the 60-day baseline. Gold's OI reduction, by contrast, remained relatively unusual against both windows.
Open interest measures outstanding contracts, not buying or selling pressure by itself. It cannot independently establish whether positions are being opened, closed, or transferred between participants.
My approach is to use both windows: the 30-day reading for sensitivity to recent positioning changes, and the 60-day reading for broader statistical context.
Data: CME open-interest statistics through 30 October 2026. Z-scores compare each daily OI percentage change with the preceding 30 or 60 observations, excluding the current observation from its reference calculation.
Weekly Commodity Analysis | 26–30 October
A week of sharp divergence across the commodity markets.
Silver and gold came under significant selling pressure, crude oil recovered, natural gas remained highly volatile, and copper struggled to establish a clear direction.
Weekly Price Performance (26–30 October)
$NATGAS: +11.38% — strongest performer this week.
base:0xa4d5501deaa04807bd5c48e3f2bf3fd9b79a4ba3 ($OIL): +2.32% — recovered to finish higher.
$COPPER: -0.76% — modest weekly decline.
$GOLD: -3.45% — selling pressure intensified.
$SILVER: -9.26% — weakest performer, with a sharp weekly decline.
What the indicators reveal
$SILVER — Bearish pressure intensifies
Silver was the weakest performer, falling 9.26% across the week. On Friday, ATR Z-score rose to +2.79, while ADX increased to 39.77 with positive momentum. The DI spread widened significantly in favour of sellers.
This is a strong combination of expanding volatility and strengthening bearish directional pressure. OI changed by only +0.05% on Friday, with a 30-day Z-score close to neutral (-0.27). The price decline therefore did not coincide with an unusual daily increase or decrease in open interest.
$GOLD — Selling pressure becomes more pronounced
Gold declined 3.45% over the week. Friday's 3.29% daily fall was accompanied by a widening bearish DI spread and rising ADX. ADX momentum remained positive, indicating that directional strength was increasing.
Open interest fell by 1.21% on Friday, with a 30-day Z-score of -1.77. This points to a relatively unusual reduction in OI, although it does not establish which market participants were closing positions.
base:0xa4d5501deaa04807bd5c48e3f2bf3fd9b79a4ba3 ($OIL) — Bullish structure remains intact
Crude oil gained 2.32% over the week. Friday's price advance was accompanied by ADX rising to 33.49, positive ADX momentum and a strong positive DI spread.
Open interest increased by 0.40%, a relatively ordinary change against the 30-day baseline. The combination supports an improving bullish technical structure, although the OI reading does not indicate unusually strong new participation.
$NATGAS — Strong weekly gain, but momentum weakens
Natural gas gained 11.38% across the week, making it the strongest performer. However, Friday's 1.83% decline came alongside a sharp fall in ADX momentum (-4.03).
The DI values were almost balanced, with buyers retaining only a slight advantage. ATR remained elevated relative to its historical baseline (Z-score +1.43).
The weekly advance has been substantial, but Friday's readings suggest that directional strength is weakening. The next sessions will help establish whether this is a temporary pause or a more meaningful change in structure.
$COPPER — Weak directional conviction
Copper ended the week 0.76% lower. Friday brought a 1.86% decline, with the DI spread turning more decisively negative.
However, ADX remained very low at 10.57, indicating limited trend strength. OI declined by 1.04%, with a 30-day Z-score of -1.83. This is a relatively unusual reduction in open interest, but it does not by itself establish the cause of the price decline.
Overall picture
The clearest bearish structures are in silver and gold, although their volatility profiles differ. Crude oil retains the strongest bullish structure. Natural gas has delivered the largest weekly gain, but its latest momentum readings warrant caution. Copper remains directionally weak without a convincing trend.
The distinction matters: price direction, trend strength, volatility and open-interest changes each tell a different part of the story. None should be interpreted in isolation.
Data: daily OHLCV and CME open-interest statistics, 26–30 October 2026. OI Z-scores use a rolling 30-observation reference window.
Commodity divergence is becoming more pronounced.
Since 27 October (latest prices 30 Oct, 20:00 UTC):
📉 $SILVER −9.50%
📉 $GOLD −4.66%
📉 $COPPER −1.70%
📈 $CRUDE ($OIL) +3.05%
📈 $NATGAS +6.90%
Silver and gold continue to weaken. Crude remains relatively resilient, while natural gas is showing a potential change in directional structure.
The technical picture matters:
• Silver: strong bearish trend readings.
• Gold: bearish directional pressure.
• Crude: bullish DI dominance persists.
• Copper: weak trend, limited conviction.
• Natural gas: DI crossover, but weakening ADX momentum.
Price alone doesn't tell the whole story. ATR, ADX, directional indicators and open interest help distinguish a daily move from a developing structural change.
30 Oct prices are latest observations at 20:00 UTC; technical indicators are latest available through 29 Oct.
#Commodities #MarketAnalysis
Five commodities. Five different market structures.
📉 $SILVER: −9.72% over 12–27 Oct, with strong bearish directional pressure.
📈 base:0xa4d5501deaa04807bd5c48e3f2bf3fd9b79a4ba3 ($OIL): +6.57%, despite a late-period pullback.
⚠️ $NATGAS: −14.84% over the period, but +3.65% on 27 Oct amid elevated volatility and contract-expiry effects.
$GOLD remained under bearish directional pressure despite its rebound. $COPPER recovered on the final day, but its ADX still pointed to a weak trend.
News provides context; it doesn't prove causation. Price, ATR, ADX, DI and open interest help separate a daily move from a broader structural change.
Full analysis: $GOLD $SILVER $COPPER base:0xa4d5501deaa04807bd5c48e3f2bf3fd9b79a4ba3 $NATGAS
#Commodities #MarketAnalysis
Method note: OHLCV and indicators sourced from Yahoo Finance; news claims cross-checked against the dataset. Benchmark labels matter: WTI closed at $99.90 on 27 Oct, while $113.88 was Brent—not WTI.
Detailed analysis at:
https://t.co/yrfkNrWdcF
@Rainmaker1973 Simplicity never gets outdated; similarly people still confuse creativity with complicated. Shame we don't have Steve Jobs any more, but instead some impressive story tellers.
📊 Crypto Market Overview | 21 → 27 Oct
$BTC $ETH $SOL $BNB $XRP
What changed since the previous snapshot?
Volatility caution eased:
• BTC IV–RV gap: +15.64 → +12.13 pp
• Volatility assessment: MODERATE → LOW
• Stablecoin-dominance warning: no longer flagged
But the picture isn't fully clear:
• Macro risk engine remains RED
• ETH dominance is weakening; ETH still underperforms BTC
• All 5 coins now have a DOWN DI-based bias
• ADX momentum is negative across all 5
• ATR is still not classified as expanding
👀 What I said I'd watch — and what happened:
RV and ATR expansion: no broad expansion signal. Normalised ATR fell across all five between 26–27 Oct.
IV–RV gap: narrowed, and the system moved to CALIBRATED.
ETH/BTC and participation: still defensive; ETH dominance weakened further.
Takeaway: volatility concerns have eased, but directional and macro caution remain. A lower volatility reading is not an all-clear signal.
Python-generated · 1Y daily OHLCV · System-specific classifications - More details are in my latest article
https://t.co/zk91ZuCY0D
📊 Crypto Market Overview | $BTC $ETH $SOL $BNB $XRP
I explained in more detail here
https://t.co/ZMNbtak5nx
The five coins in this snapshot show a common pattern: realised volatility is low and falling, but the wider market context remains defensive.
• BTC: RV 23.2% (annualised - (daily RV change: -9.19 percentage points)
• ETH: 32.0%
• BNB: 29.5%
• SOL: 40.4%
• XRP: 41.5%
All five sit at the 3.3rd percentile of their recent RV distribution in my system. ATR is not classified as expanding for any of them.
ADX is also at a low recent percentile. Direction is uncertain: BTC and XRP have a slight DI-based upward bias; SOL, ETH and BNB a downward bias.
⚠️ The macro picture adds caution:
BTC implied volatility (DVOL) is 38.9 versus ATR-based realised volatility of 23.2 — a 15.6-point premium.
Realised volatility is declining: the macro model's RV momentum is -16.22, while the latest one-observation change is -9.19 percentage points. These are different measures of the decline, not conflicting figures.
Stablecoin dominance is strengthening, and ETH is underperforming BTC. The macro risk engine is RED.
This is not confirmation of an imminent volatility spike or further decline. It is a market with subdued realised movement but defensive positioning signals worth monitoring.
👀 Watch: RV and ATR for renewed expansion, ADX/DI for directional follow-through, and whether the IV–RV premium persists.
Python-generated · 1Y daily OHLCV · 30-observation statistical context · Descriptive, not predictive.
daily data up-to latest complete ohlcv - 21 Oct 2026
Crypto Market Overview | $BTC $ETH $SOL $BNB $XRP
Realised volatility is near the bottom of its recent historical range across all five assets, while ATR is not expanding. Yet BTC's implied volatility premium and defensive macro signals suggest caution. https://t.co/emYScFRQ6g
Crypto Market Overview | $BTC $ETH $SOL $BNB $XRP
Realised volatility is near the bottom of its recent historical range across all five assets, while ATR is not expanding. Yet BTC's implied volatility premium and defensive macro signals suggest caution. https://t.co/emYScFRQ6g