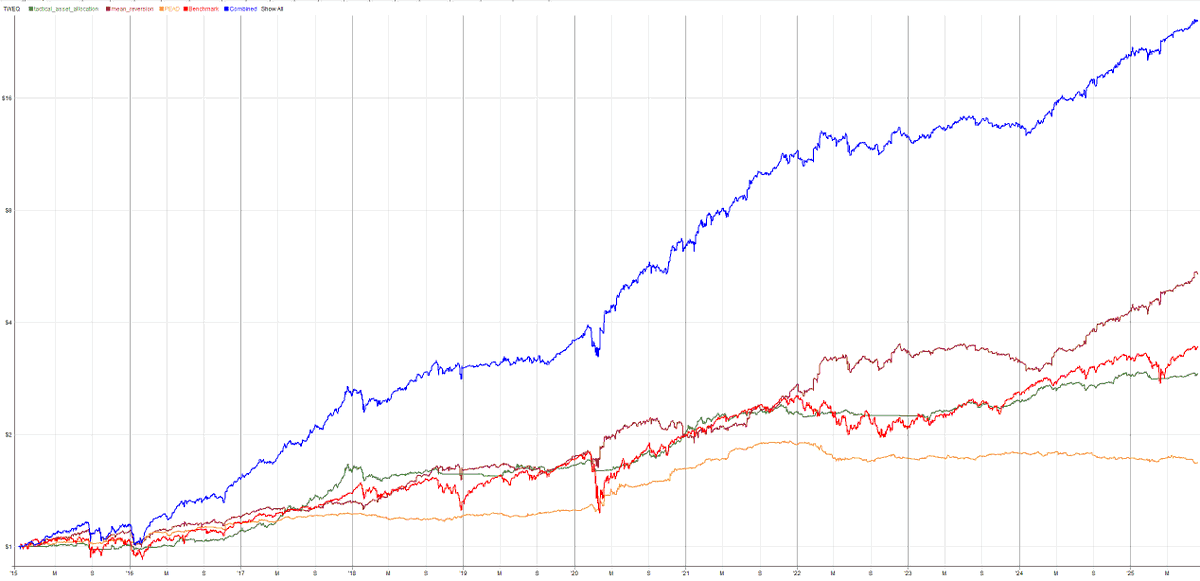
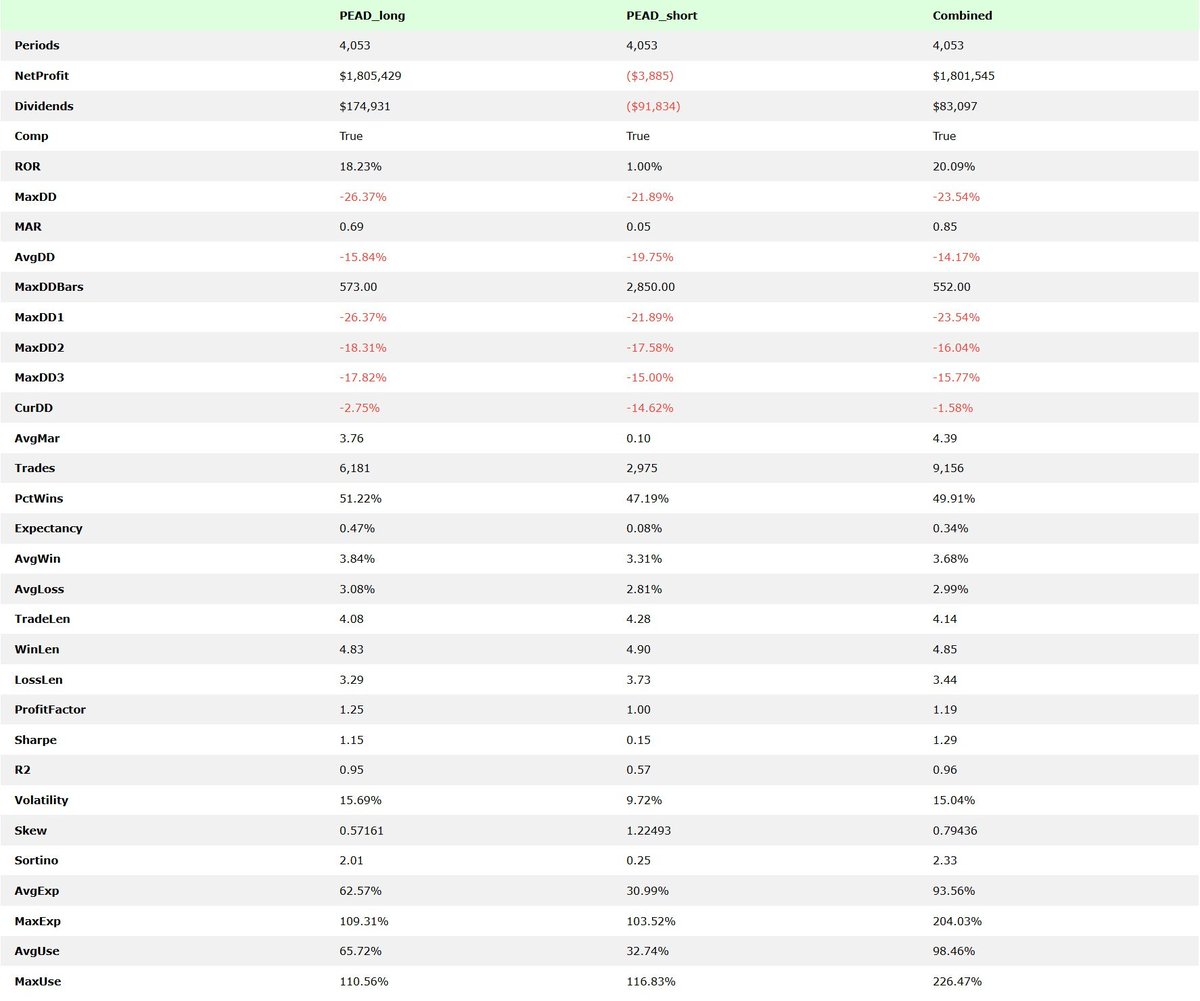
📈I have been a bit lazy posting my progress on my Post Earnings Announcement Drift model so I will have to come back to it. The short story is that I have created a portfolio with a Tactical Asset Allocation, MR & PEAD strategies which has just gone live at market open 🚀
Let's see how it performs live over the coming months.
Is the deleveraging just a natural part of strategies entering and exciting or are you running vol targeting or something else to lever up and down.
Mine just moves up and down with strategies entering/exiting, turning on / off etc. While drawdown hasn't been terrible the current volatility is running higher than long term average and suggests a larger possible drawdown than testing over the last 20 years suggests. I have been thinking about diving in to volatility targeting to try and limit risk of the unexpected.
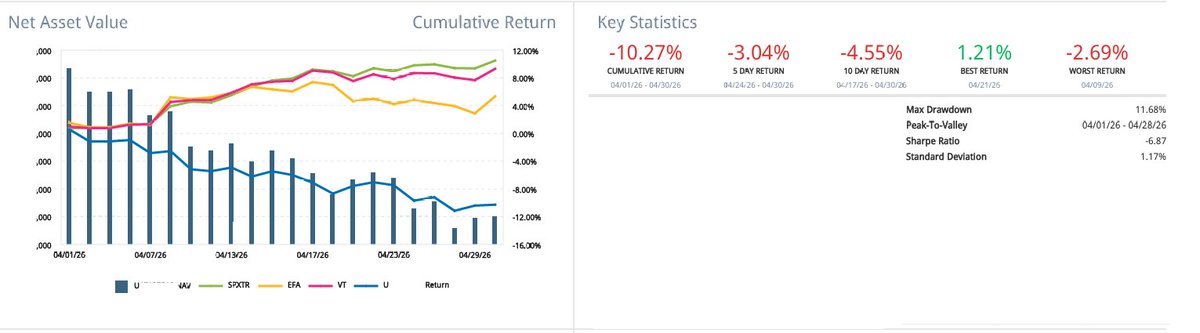
$CAR Crash? Hit n Run? April 2026 -10.27%
April 2026 was a bit of a clusterfuck for me with over half my losses coming from positions in $CAR. Couple this with exits from my long momentum and equity index positions at the start of the month.
My Value Momentum system had a longer term short in $CAR from $95 and my mean reversion systems tried to short it a few times. Two days before the drop I decided to override my system and close the value momentum short and latest mean reversion short in post market – who knew how much higher it was going to go and would my borrowed stock get pulled and I get closed out at a much worse price.
Whilst it sucked that it only went up one more session before tanking, I don’t regret that decision. What I do regret is not having an emergency short stop rule for my value momentum system like I do all of my other systems. I am quite ok with taking on risk, but when something starts to get into the ridiculous you are better off just getting out in my view.
Top 3 Systems:
- Tactical Asset Allocation
- PEAD
- Volatility Risk Premia
Bottom 3 systems:
- Value Momentum
- Mean Reversion
- Short term breakout
You win some, you lose some!
@JoachimMo1985 😂🤣😂 was going to do a post about how I am getting smoked by $CAR and then saw this. I had two systems short it. A short term and longer term.
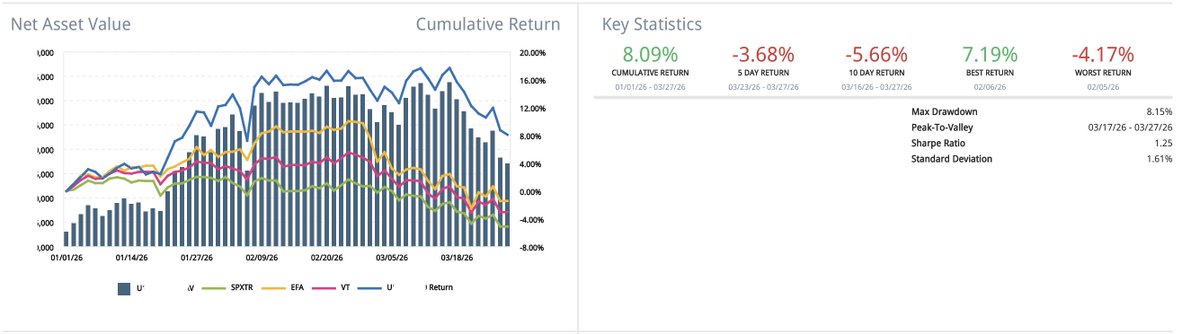
March Stats - -2.51%
Top Performing Strategies in March:
- Mean Reversion
- Tactical Asset Allocation
Bottom Performing Strategies March:
- Value Momentum
- Index Mean Reversion
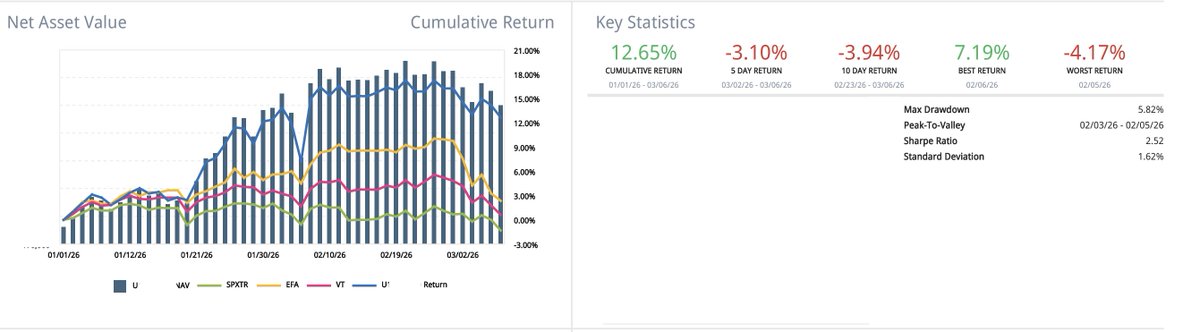
Year to date stats after March
Top Performing Strategies so far:
- Mean Reversion
- Tactical Asset Allocation
Bottom Performing Strategies so far:
- Volatility Risk Premia
- Short term breakout
Getting a bit of a touch up in March!
Just from the scientific method of eyeballing, worst performing strategies:
- Volatility Risk Premia
- Short Term Breakouts (tend to get spiked in and then fucked)
- Value Momentum
- Index mean reversion (all mean, no reversion!)
@momentmal2022 Yeah technical momentum took a dive for me this week too. Value Momentum was up though (although not as much as technical momentum was down).
@momentmal2022 It is mainly just for insurance when the market goes down overall and I don't know what is going to happen in the future. Even though it doesn't return much on it's own it does smooth out the equity curve and give a slight boost to the strategy overall.
I use RealTest by @mars10p combined with norgate data @NorgateData. Everything is combined in one script which allocates capital to strategies or groups of strategies. Each day before the open I import the previous day's data which takes about a minute and then hit a button to generate orders based on capital allocation for each of the strategies and send to IBKR. Only takes a few minutes.
Some of the strategies require some calculations in python but that can be imported into RealTest and used in the strategies.
This is what it looks like back to 2010 (my data becomes sparser before then). I trade 100% long / 100% short (although outside reporting season all positions aren't filled). I am not precise as in trading the announcement, I rotate weekly based on earnings for the previous 5 days with 10 long / 10 short.
I have a combination of features which I think show value or might be indicative of future value and I combine them with a number of technical momentum features (maybe 4 different ways of measuring momentum from memory). I also use "momentum" in some of the value features.
For example, if I thought increasing institutional investment in a stock was indicative of value or potential future value, I might measure if it is increasing QoQ and if the increase is accelerating and vice versa for decreasing.
I have then applied a simple machine learning and ranked stocks on that basis. Long top n, short bottom n.